
Overview: separate reported revenue from incremental revenue
Compare platform-reported numbers against incremental results, and see how much of your budget is genuinely working.
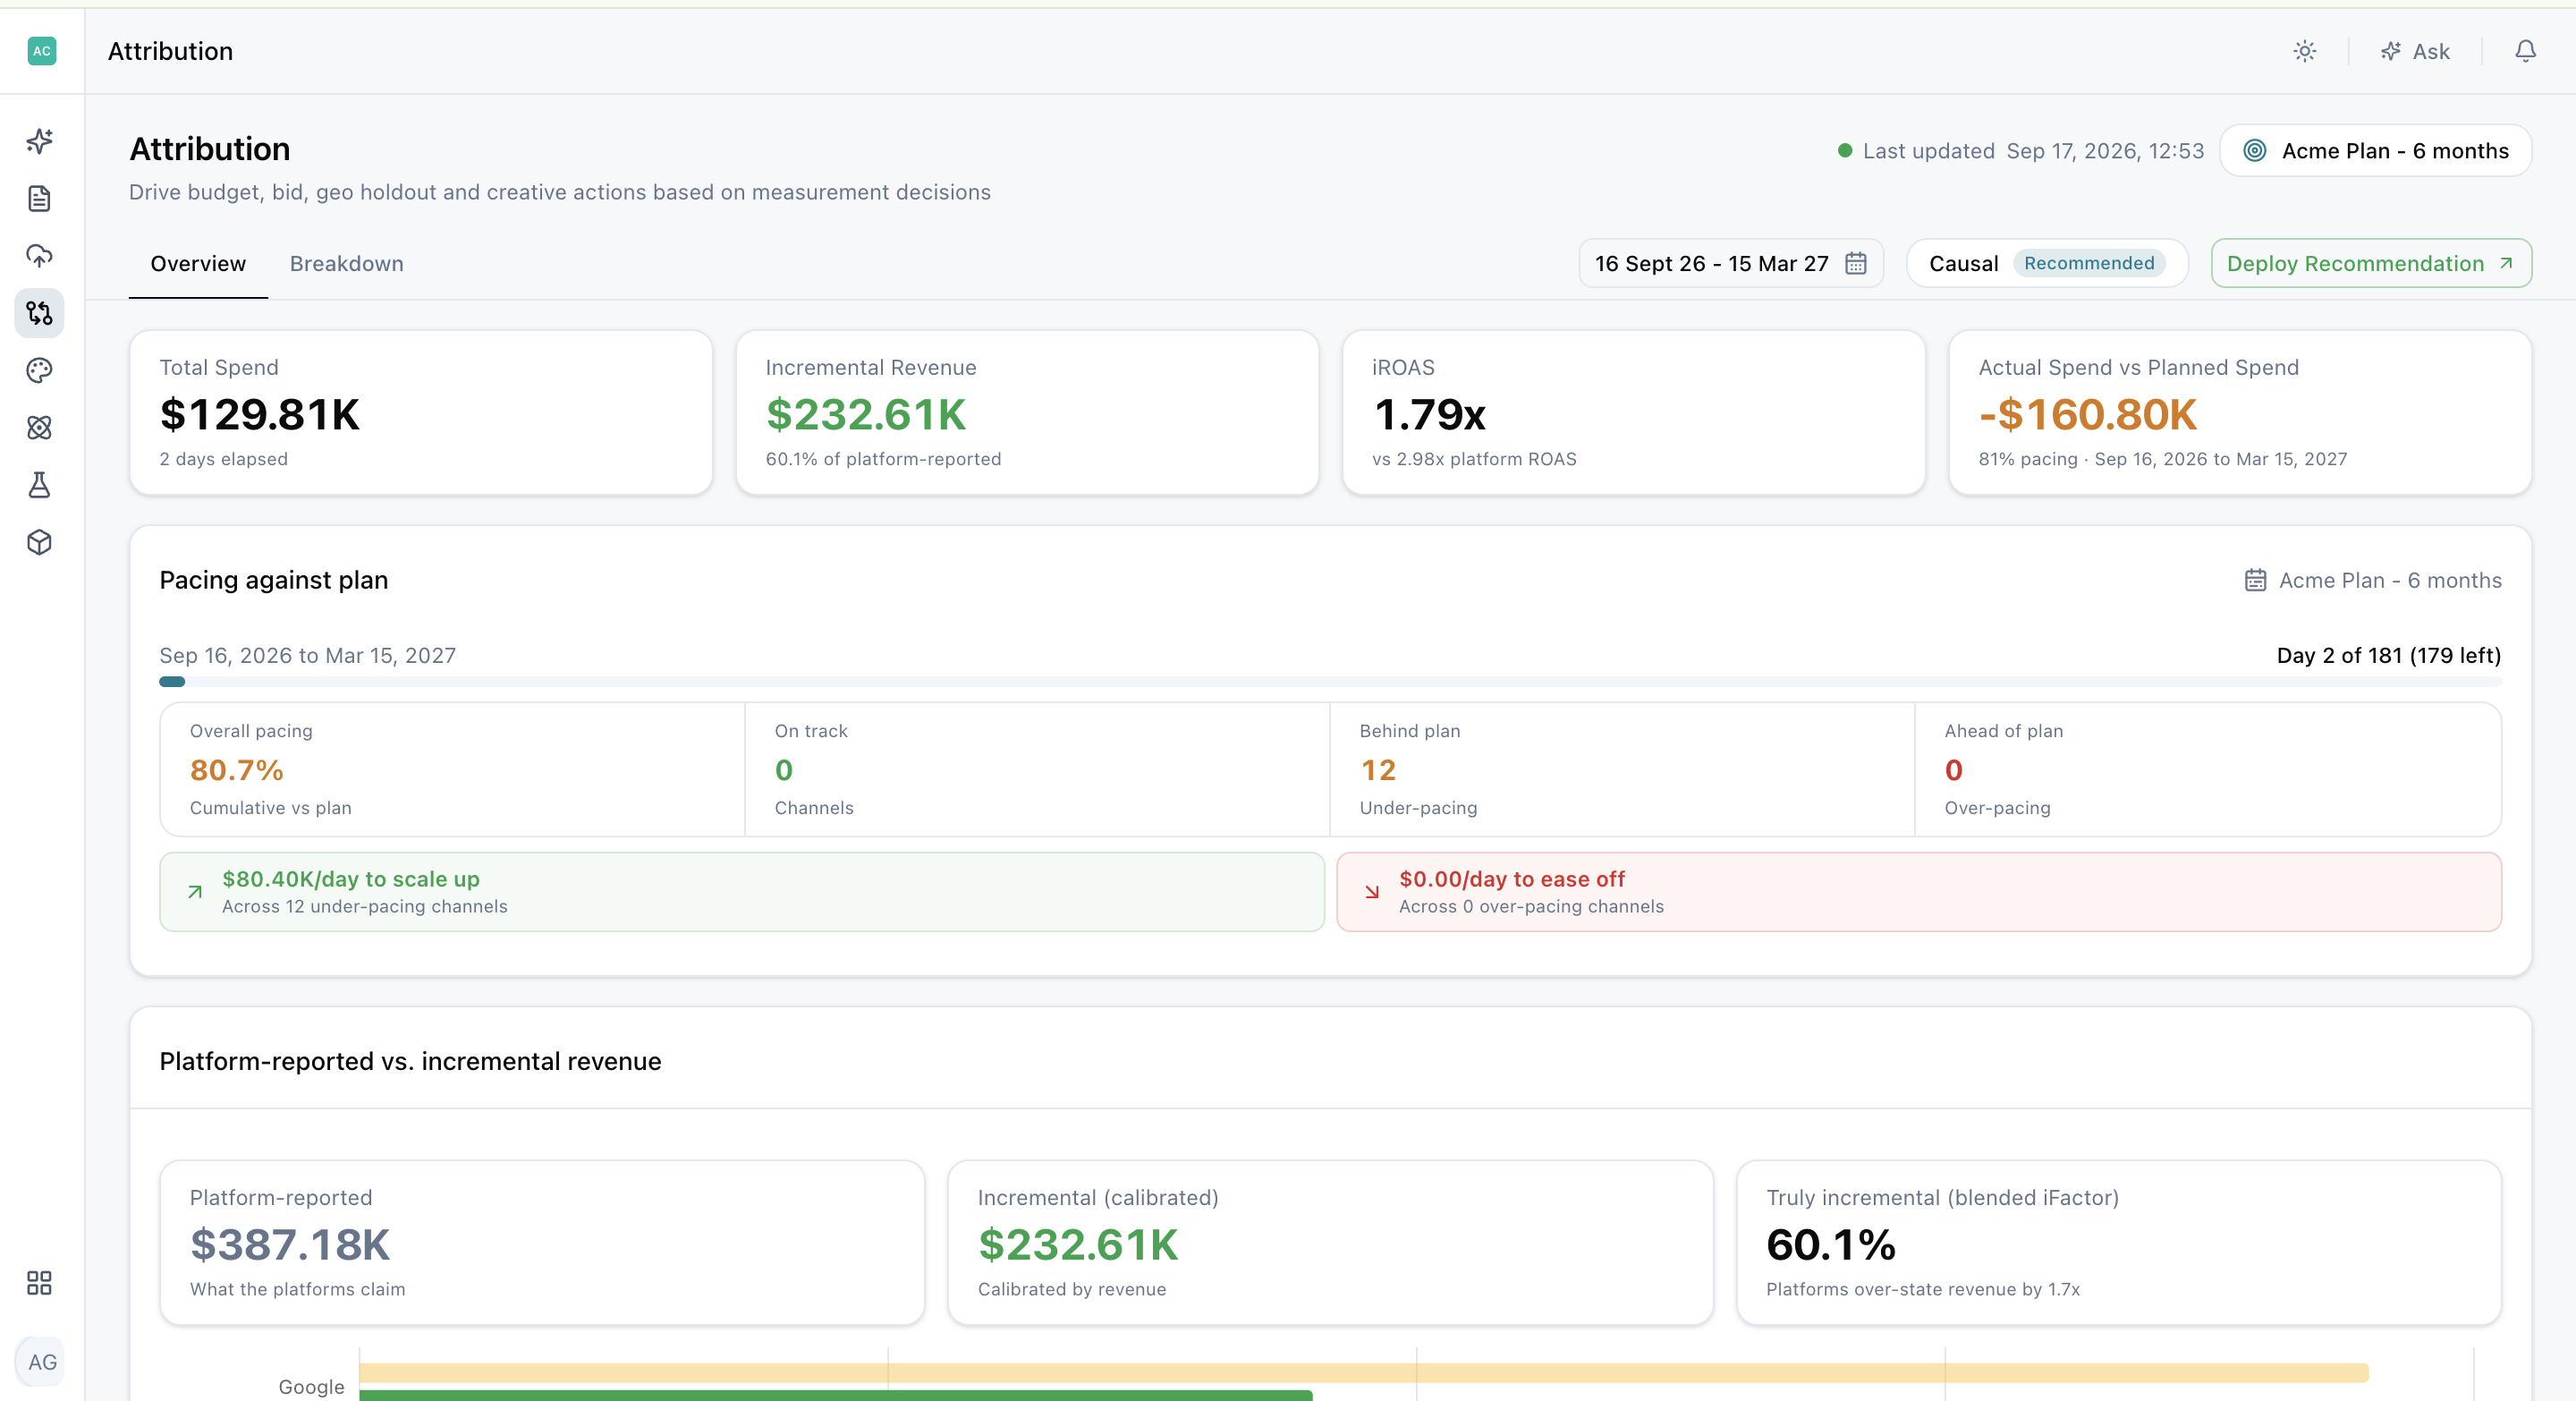
Overview shows whether the money you spent in the selected period actually produced revenue, and whether you are on track against the plan you committed to. It brings spend, incremental revenue, and pacing into one screen so you can decide what to fund, what to cut, and what to fix before the period closes.
What controls the view
Everything on this screen is scoped by two controls:
- Date picker: sets the reporting range.
- Target scenario control: sets the plan you are being measured against.
Change either one and every metric below recalculates.
Know where you stand
The cards at the top give you the shortest possible read on performance.
- Total Spend shows what you have invested across all channels in the selected range, with the number of days elapsed in the scenario so you can judge whether the spend level is reasonable for how far into the period you are.
- Incremental Revenue shows the revenue Lifesight estimates you would not have earned without the advertising, along with its share of platform-reported revenue. The gap between the two is the part of platform-reported revenue that would likely have converted anyway.
- iROAS (incremental return on ad spend) shows incremental revenue divided by spend, set against platform ROAS for the same period. Platform ROAS will almost always be higher. The distance between them tells you how much of your reported performance is credit the platforms are claiming for conversions they did not cause.
- Net vs Plan shows how far above or below your planned spend you are, with overall pacing for the scenario. Read this alongside elapsed days: being 10% under plan means something very different on day 3 than on day 25.
Read the cards together
Look at the cards as a set rather than one at a time. Patterns across them reveal more than any single number:
- Rising spend with flat incremental revenue: you are buying volume that is not adding demand.
- Flat spend with rising iROAS: your mix or creative has usually improved.
Check pacing before judging performance
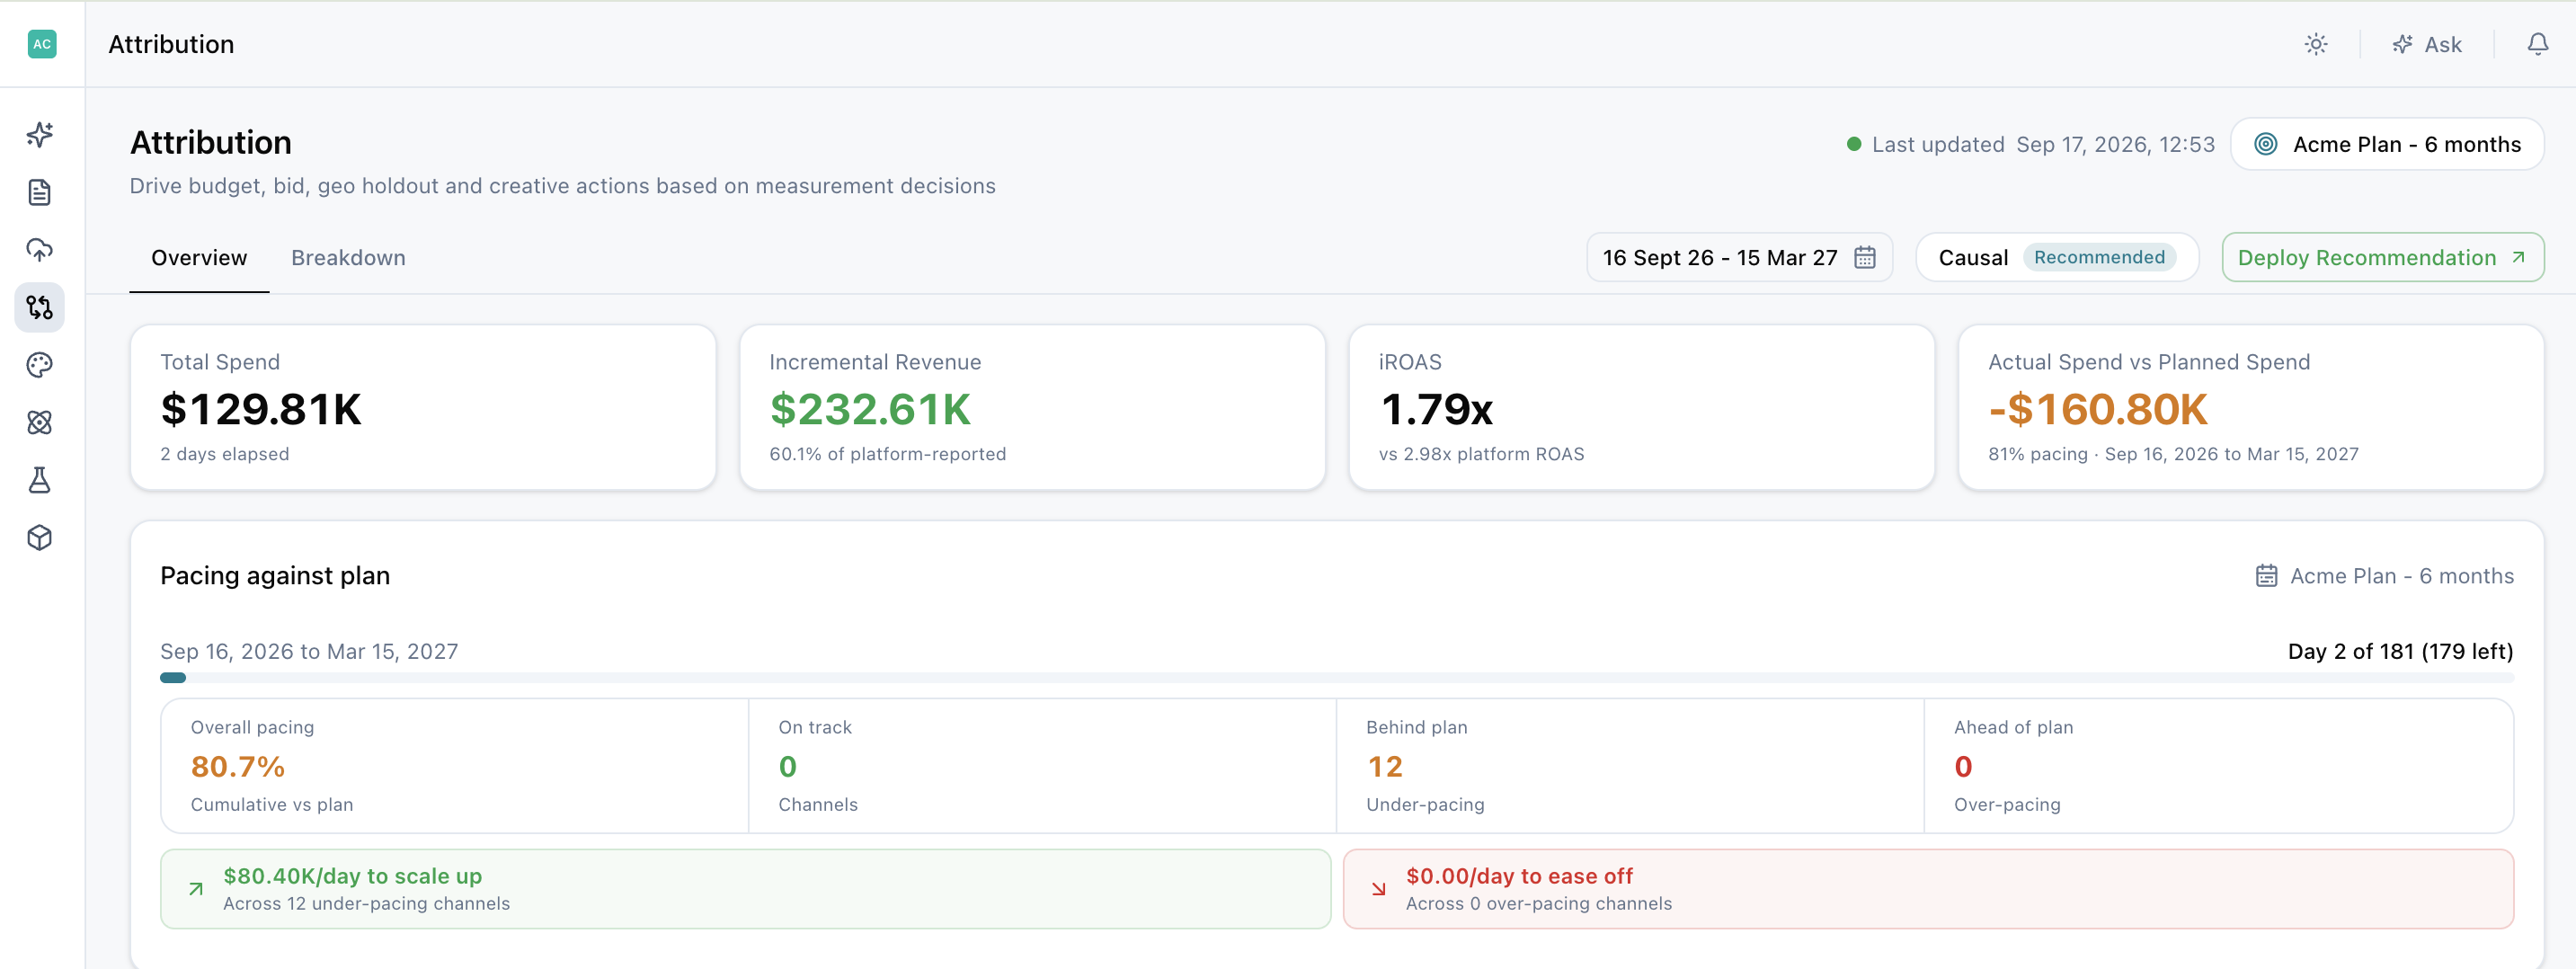
The pacing section compares actual spend with planned spend from the active scenario, so you can separate a performance problem from a delivery problem. A channel that looks weak on revenue may simply never have received the budget it was planned for.
What you can review
- Scenario progress: how much of the period has elapsed.
- Cumulative spend versus plan: whether the gap is widening or closing over time.
- Channel counts: channels split into on track, behind plan, and ahead of plan, so you know how concentrated the problem is.
Suggested daily adjustments
Suggested daily adjustments convert those gaps into a number you can act on:
- For under-pacing channels: how much daily spend needs to scale to land on plan by the end of the period.
- For over-pacing channels: how much to ease off to avoid overshooting.
These are spend corrections, not performance recommendations, so pair them with the channel table before you move budget. A channel may be behind plan, but if its incrementality factor is low, catching up on spend may not be the best use of that budget.
See what you actually caused
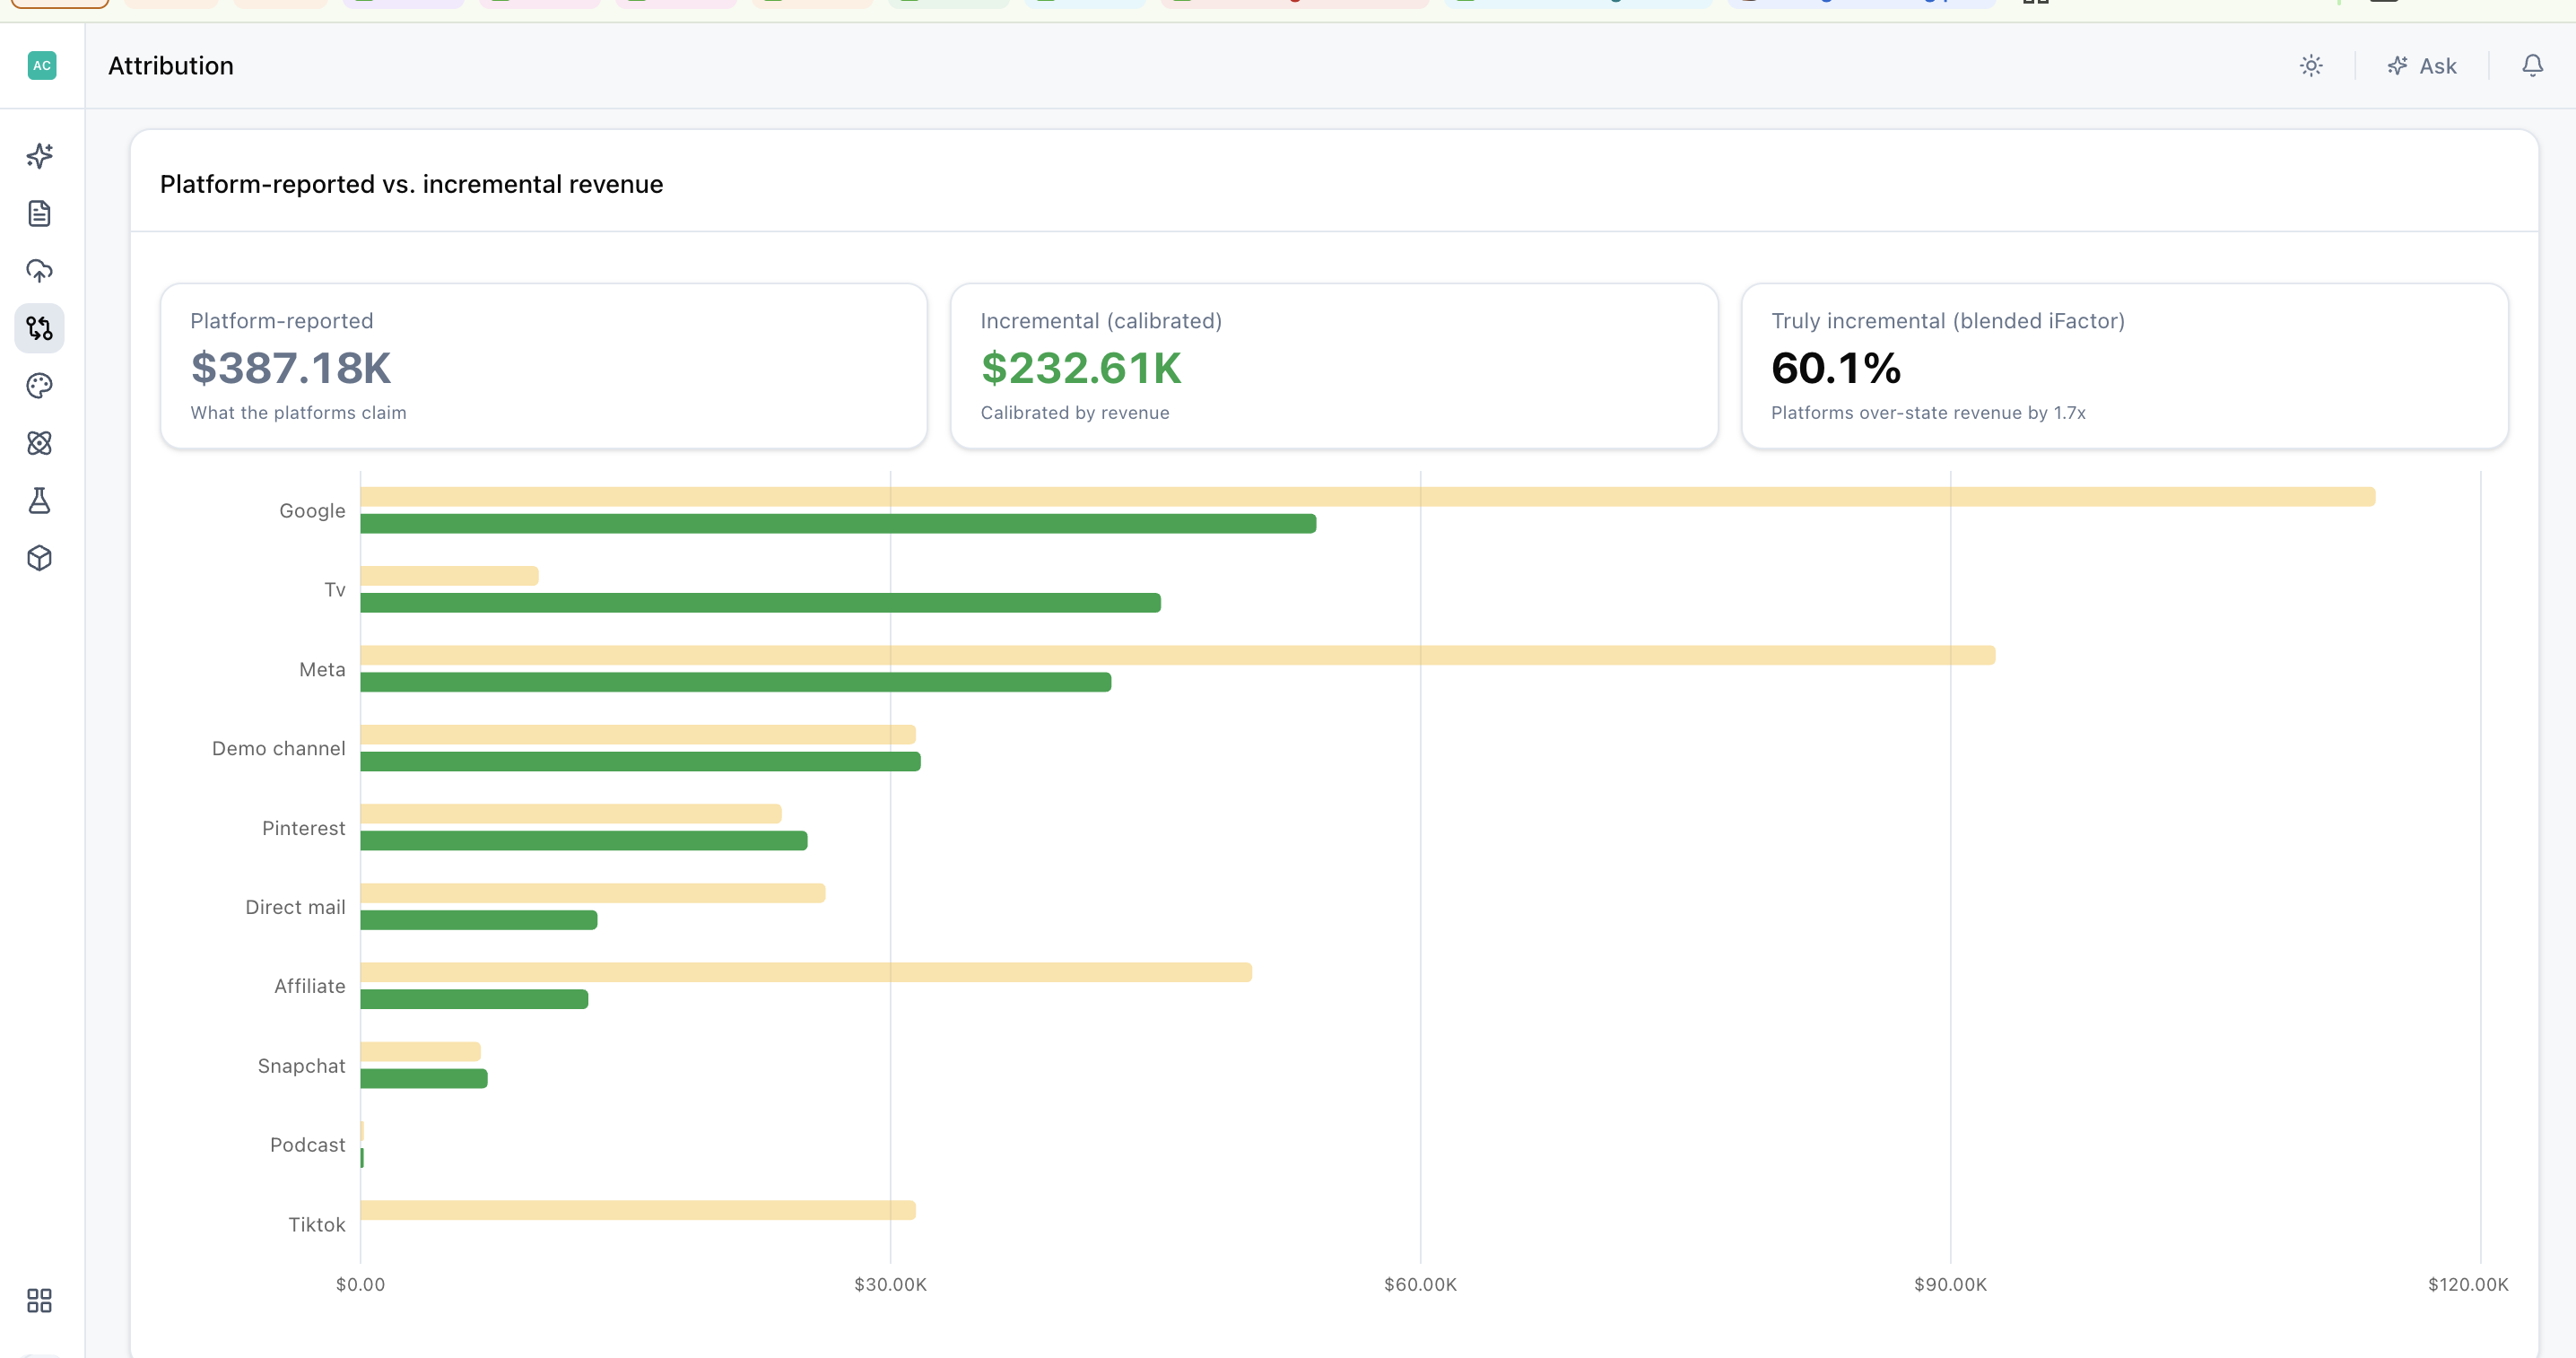
This comparison puts platform-reported revenue next to the revenue Lifesight estimates was causally incremental (revenue that would not have happened without the ad).
Incrementality factor
The incrementality factor is the share of platform-reported revenue estimated to be incremental. A factor of 0.4 on a channel means roughly 40 cents of every reported dollar is genuinely new revenue, and the rest is demand that was already coming.
Why it matters
This is the number to bring to any conversation about why your platform dashboards and your revenue do not reconcile. Channels with high reported revenue and a low incrementality factor are usually harvesting existing demand rather than creating it. That is a signal to rebalance rather than to switch off, since some of that spend may still be defending sales you would otherwise lose.
Decide where the next dollar goes
The channel table ranks every channel by incremental value, so the channels contributing the most real revenue sit at the top regardless of how large their reported numbers are.
What you can review for each channel
- Spend in the selected range
- Incremental Revenue attributed to that channel
- Platform ROAS as reported by the platform
- Incrementality factor, so you can see how much of that reported performance holds up
- Pacing against the channel's planned spend
- Recommendation, which combines incrementality and pacing into a suggested direction such as scaling, holding, or reducing
- Actions, where you open the recommendation to see the reasoning behind it and act on it
The pattern to look for
Watch for a channel with strong platform ROAS, a low incrementality factor, and ahead-of-plan pacing. That is budget working hard on paper and producing little in reality. It is usually the fastest place to free up spend for channels that are under-pacing with a high incrementality factor.
Change the period or benchmark
Date picker
Use the date picker to change the reporting range.
- Shorter ranges surface recent shifts in performance.
- Longer ranges are more reliable for channels with slower conversion cycles, since incremental effects take time to register. For example, CTV or YouTube may need several weeks before their full impact shows.
Target scenario control
Use the target scenario control to review or change the active benchmark. The scenario is the plan your pacing, Net vs Plan, and suggested daily adjustments are all calculated against. Switching scenarios changes what counts as on track without changing any of your actual spend or revenue data.
Frequently Asked Questions
What controls the numbers on the Overview?
The date picker sets the reporting range, and the target scenario control sets the plan you're measured against. Changing either one recalculates every metric.
Why is platform ROAS higher than iROAS?
Platform ROAS counts all conversions a platform credits to its ads, including ones that would have happened anyway. iROAS counts only the incremental revenue your spend created, so it is almost always lower.
What does an incrementality factor of 0.4 mean?
Roughly 40 cents of every reported dollar is genuinely new revenue. The rest is demand that was already coming.
Should I switch off a channel with a low incrementality factor?
Not necessarily. A low factor usually signals that the channel is harvesting existing demand, which is a reason to rebalance spend rather than switch it off entirely.
How should I read Net vs Plan?
Read it alongside elapsed days. Being under plan early in the period is very different from being under plan near the end.
What are suggested daily adjustments?
They show how much to increase or decrease daily spend on a channel to land on plan by the end of the period. They are spend corrections, not performance recommendations.
Why does a channel look weak on revenue?
Check pacing first. A channel may simply not have received the budget it was planned for, which is a delivery problem rather than a performance problem.
How are channels ranked in the channel table?
By incremental value, so the channels contributing the most real revenue appear at the top, regardless of their reported numbers.
Where can I see why a channel got a specific recommendation?
Open Actions for that channel to see the reasoning behind the recommendation and act on it.
Which date range should I use?
Shorter ranges show recent shifts. Longer ranges give more reliable results for channels with slower conversion cycles.
Does changing the scenario change my actual results?
No. Switching scenarios changes what counts as on track, but your actual spend and revenue data stay the same.
Updated about 1 hour ago