
Model Data
See what your model is built on, so you can trust what it tells you.
Data gives you confidence that your model is built on the right information, so you can trust its results before you act on them. It lets you validate the data used by the selected model, catching missing values, misclassified variables, and unexpected totals before they affect your analysis.
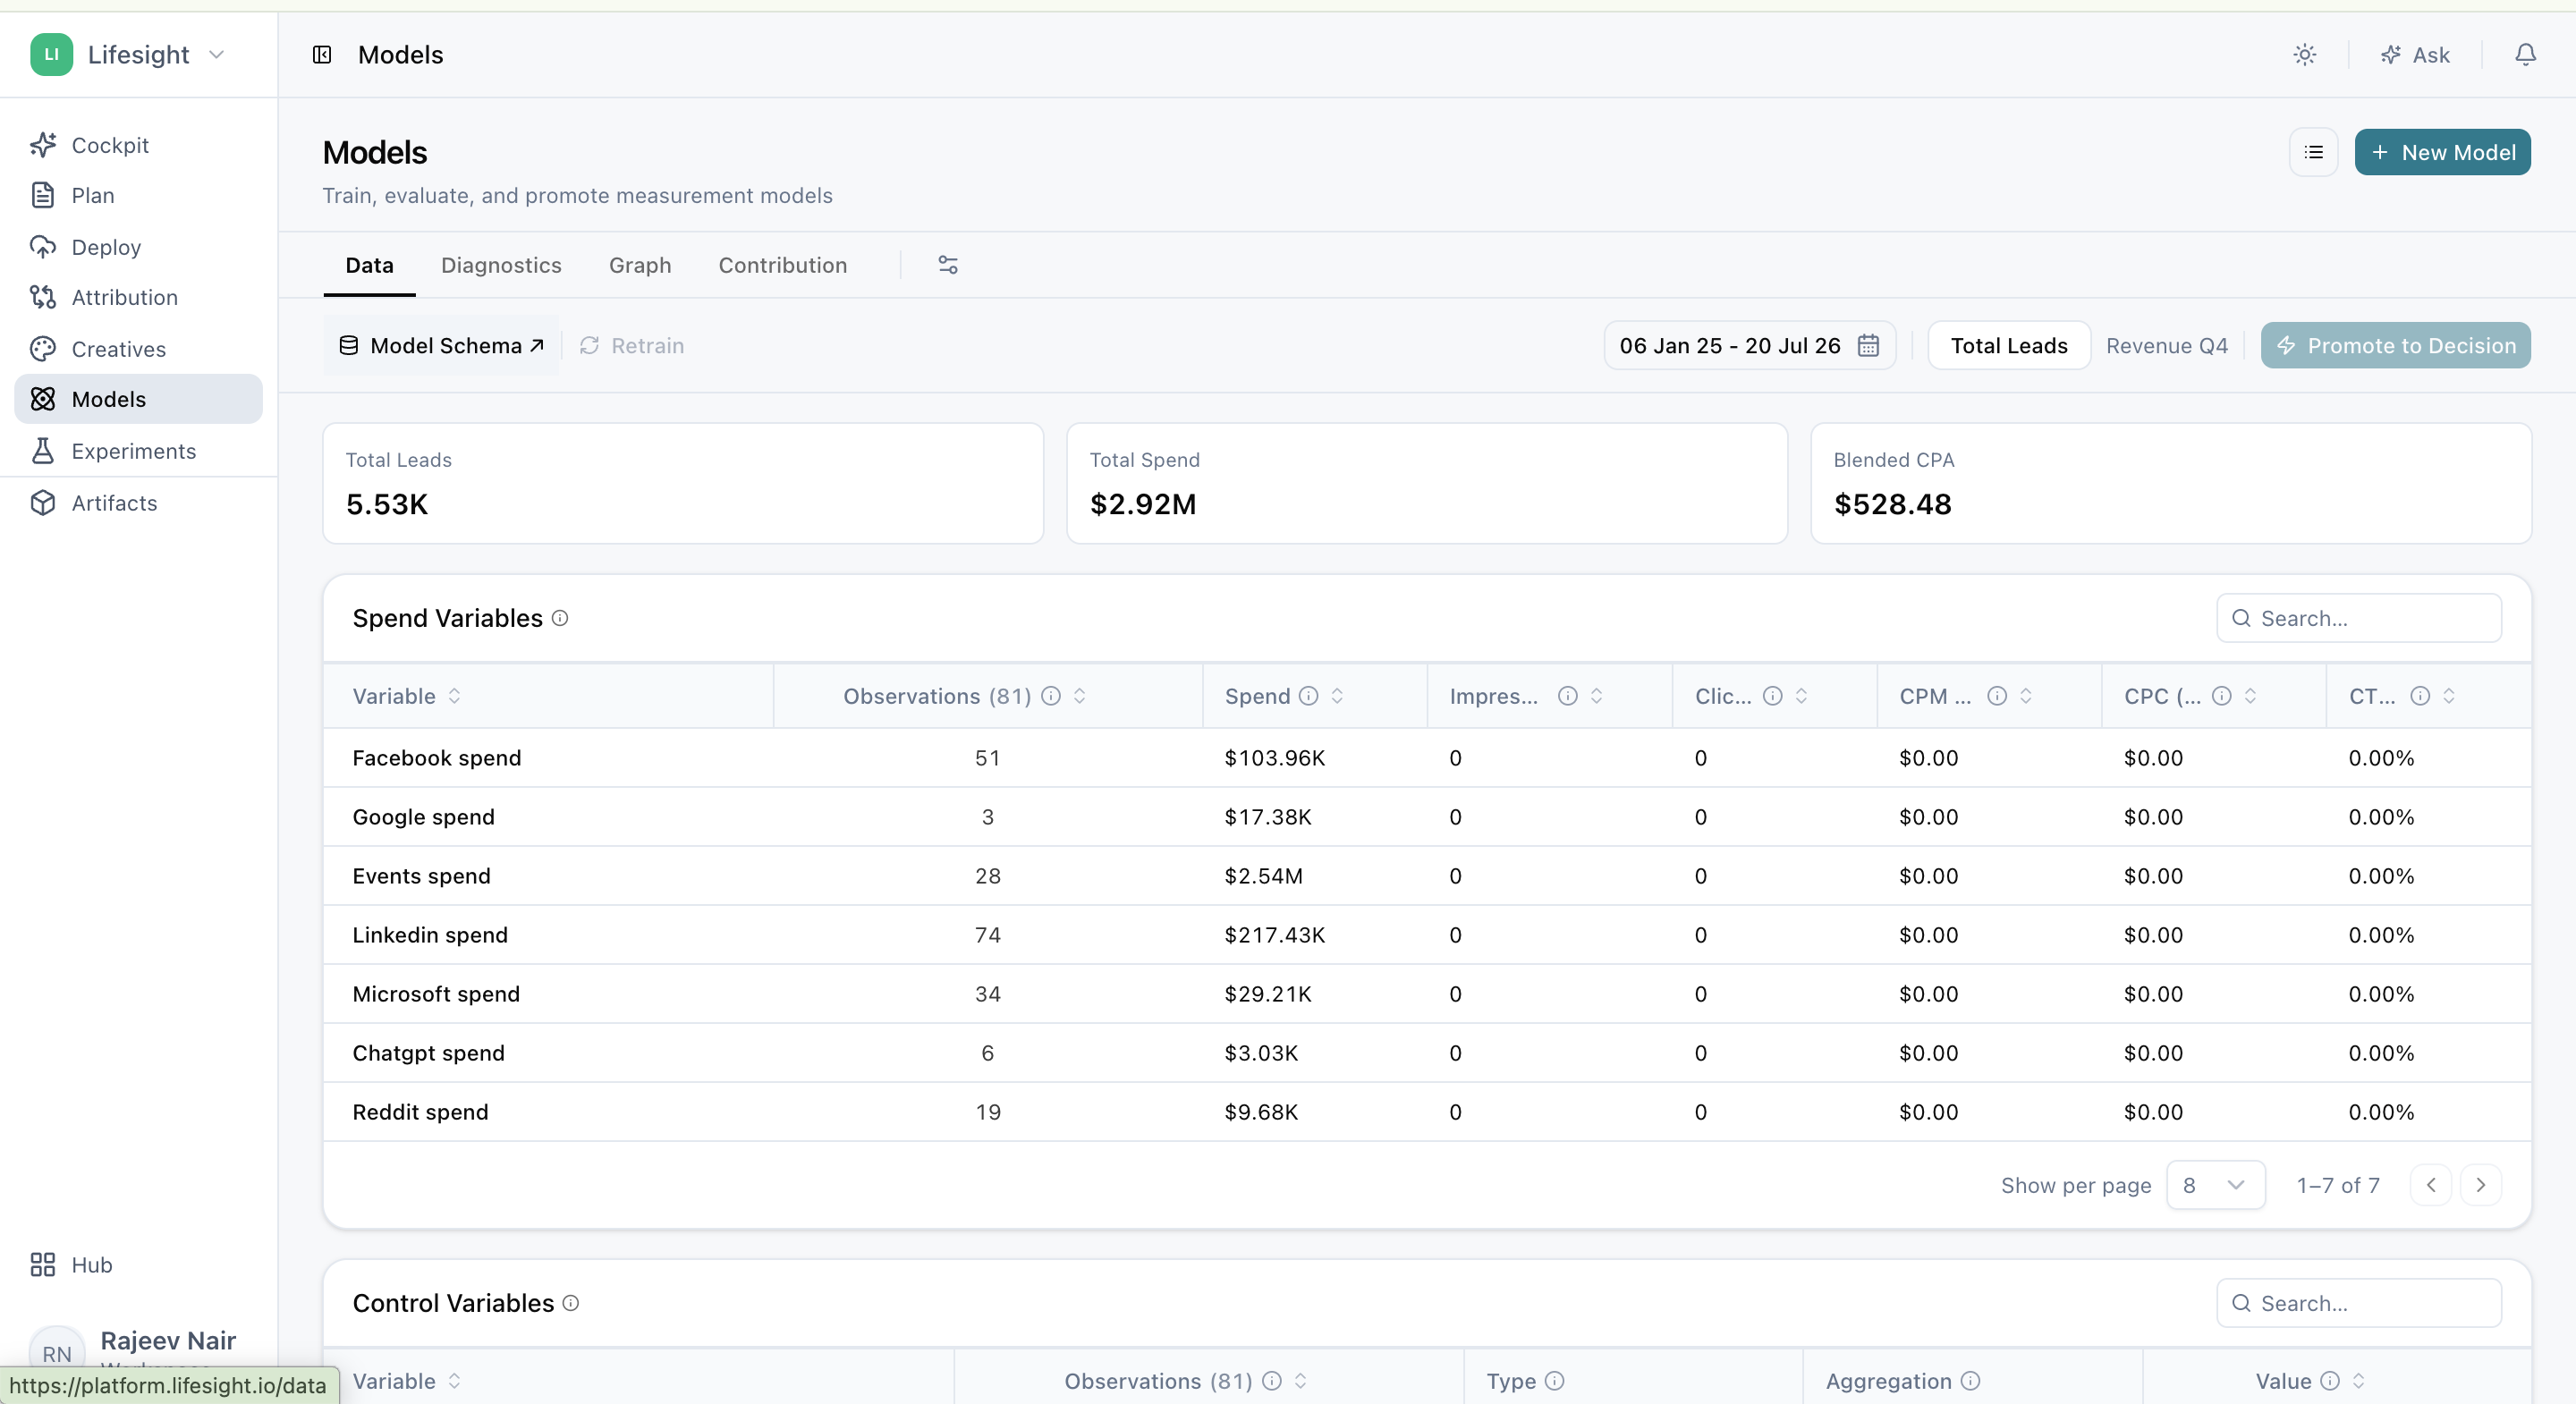
Check your data at a glance
The summary gives you a quick first check on whether your data looks the way you expect.
What the summary shows
- Spend and control-variable counts for the selected period (control variables are non-media factors, such as pricing or seasonality, that the model accounts for)
- Total spend
- Total outcome
- Blended efficiency (overall outcome relative to total spend, across all channels)
- Data-quality information
What to look for
Investigate any of the following before continuing:
- Totals that don't match what you expect from your source data
- Missing variables
- A date range that doesn't match the intended analysis period
For example, if total spend is noticeably lower than your finance figures for the same period, a channel or date range may be missing.
Spot data issues over time
Plotting outcome, spend, paid, organic, and control variables over time shows you how each one behaves and where they move together.
How to compare variables
- Plot multiple variables at once when you need to compare their timing or scale.
- Use the comparison period to add context, such as how this year's pattern compares with last year's.
What to watch for
- Gaps or flat stretches where data may be missing
- Sharp shifts that usually trace back to tracking or taxonomy changes (changes to how channels, campaigns, or tactics are named or grouped)
- Spend appearing outside the campaign window it belongs to
- Outcome movements that line up with promotions or known business events
Similar movement between two variables can be useful context, but correlation alone does not establish causality. Two variables rising together doesn't mean one caused the other.
Confirm every variable is set up correctly
The input tables describe all the variables available to the model, so you can confirm each one is correct before relying on the results.
What you can review
Search, filter, and sort to review each variable's:
- Category
- Spend
- Mean
- Observations
- Aggregation (the level at which data is summarized, such as daily or weekly)
- Available media metrics
Why classification matters
Confirm that each variable is classified correctly. Paid, organic, contextual (external factors such as weather or economic conditions), halo (effects one product or brand has on another), and outcome variables each play a different role in the model and in downstream contribution reporting. A paid channel classified as organic, for example, won't be credited correctly in your results.
See how variables relate
The correlation matrix shows how closely your variables move together, helping you spot relationships that could affect how the model separates each channel's impact.
How to use it
- Switch between Raw Input and Transformed correlations where transformed results are available.
- Select a heatmap cell to inspect that relationship in a scatter plot.
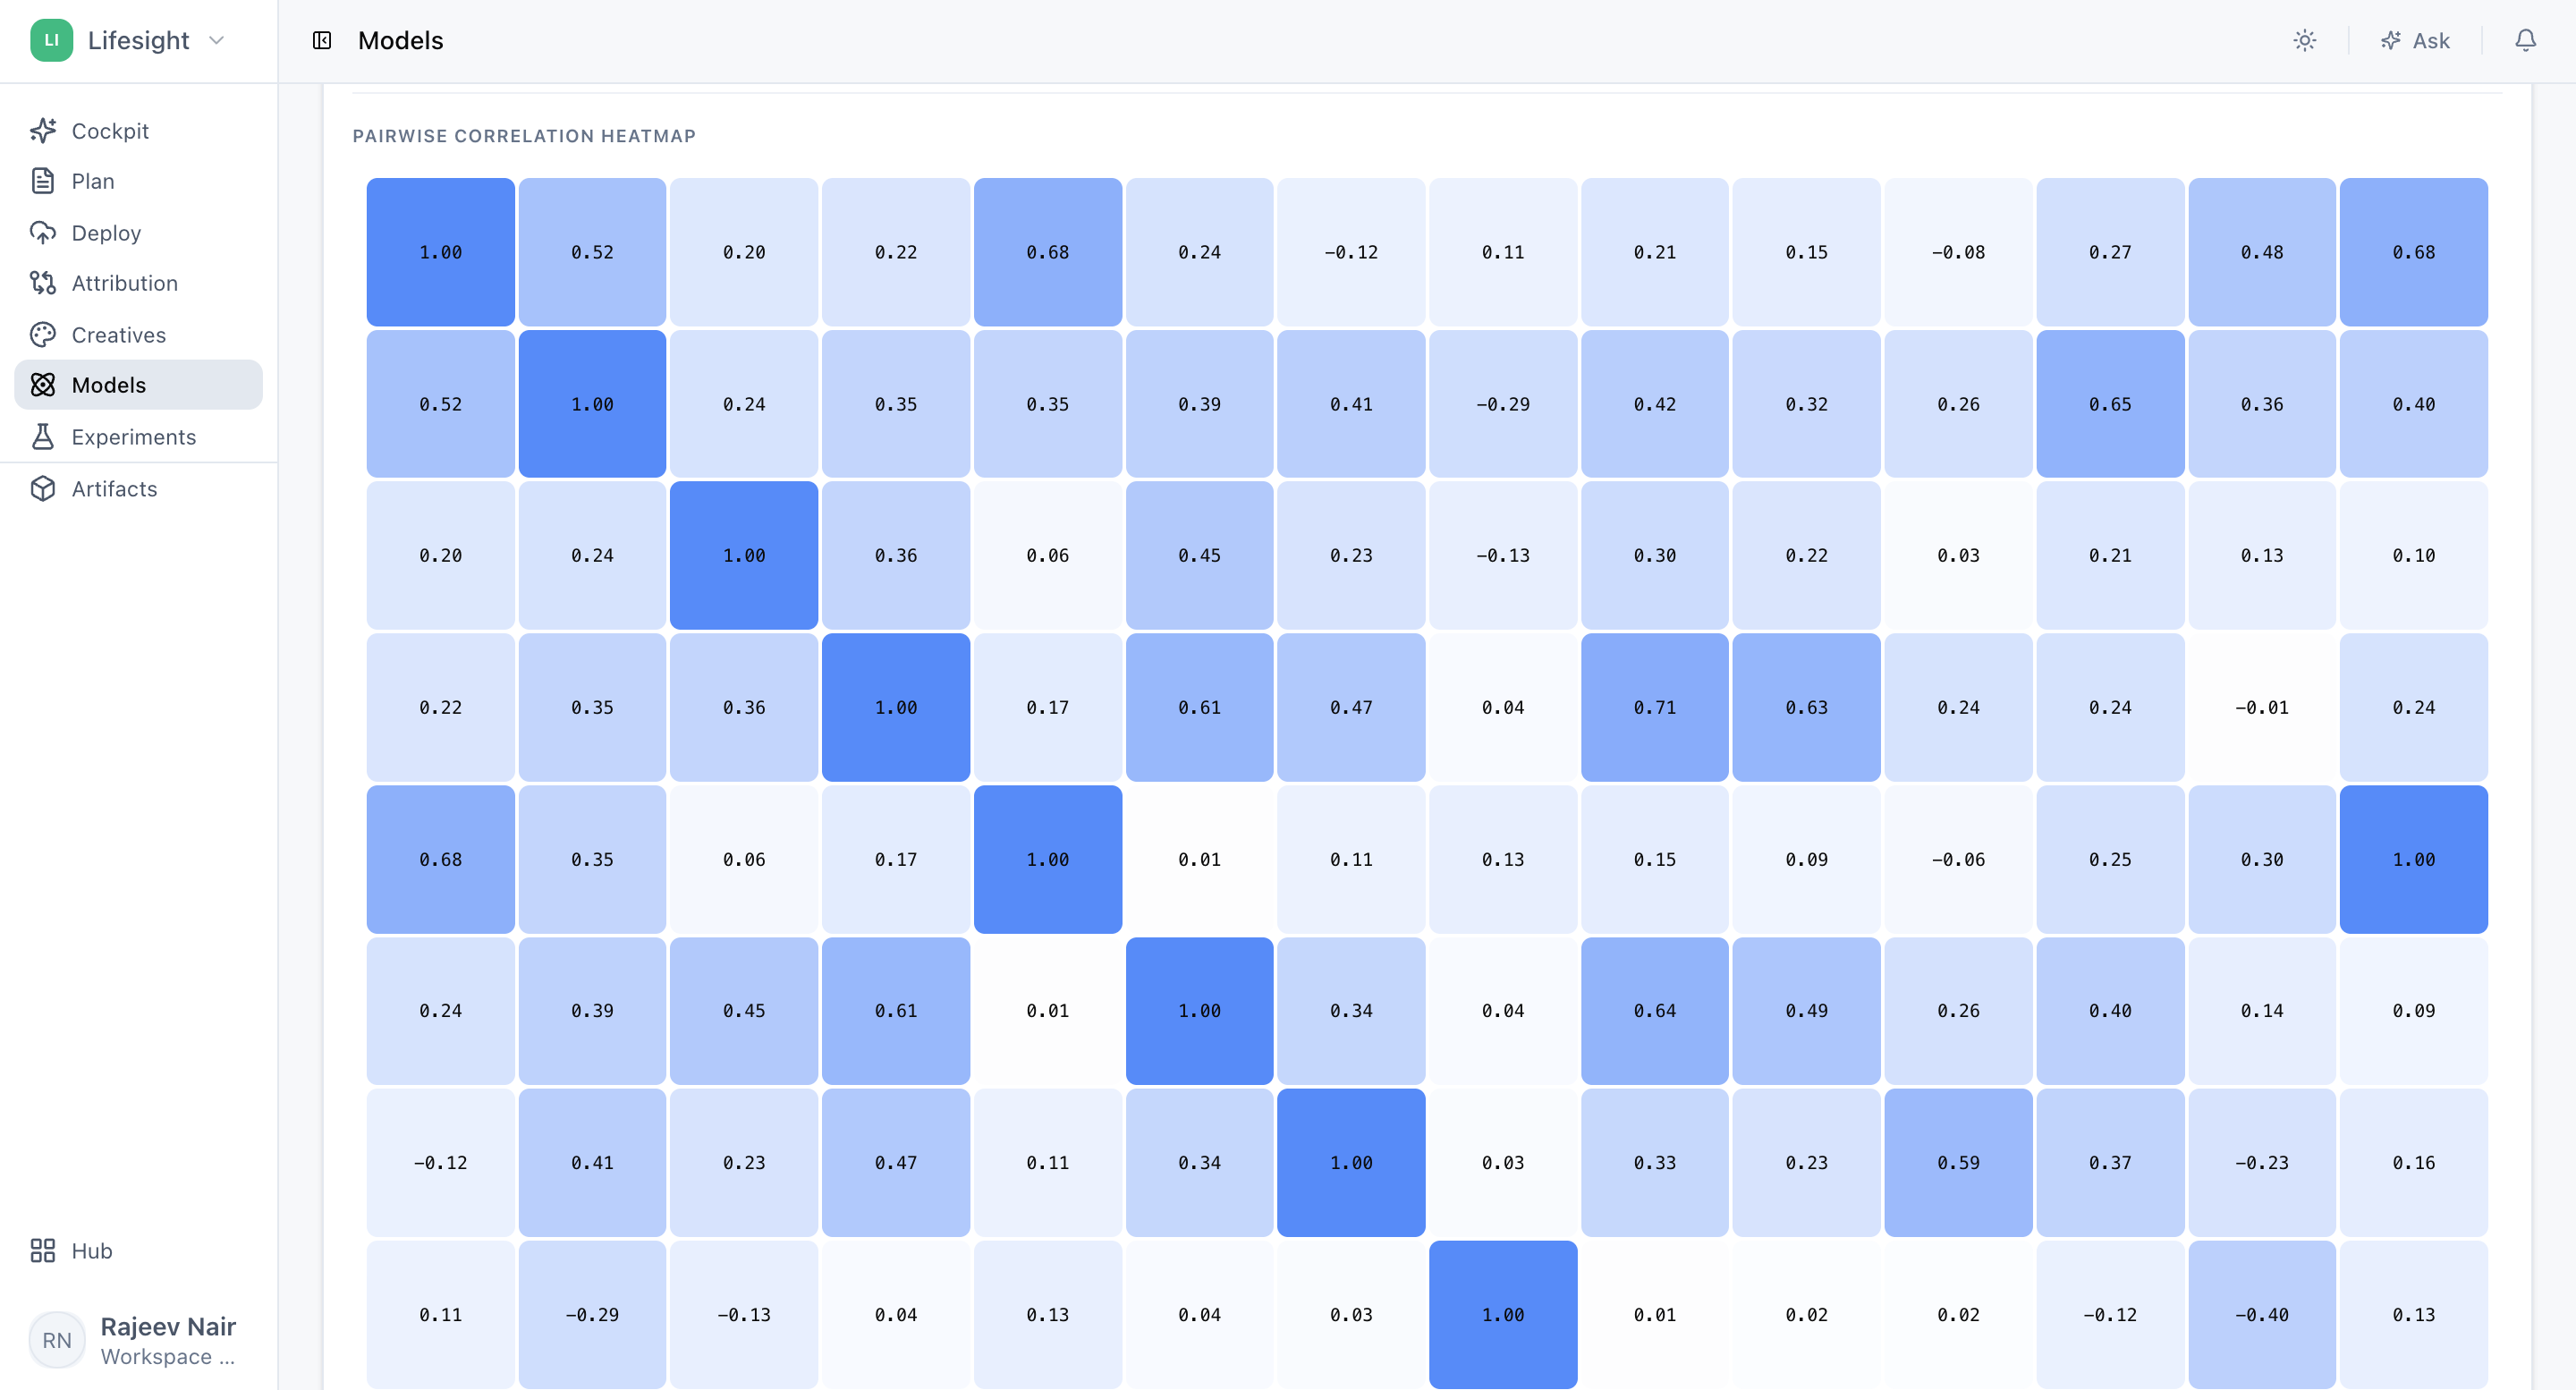
What high correlation means
- Between paid variables: high correlation can make their individual effects harder to separate. For example, if two channels always launch and pause together, the model may struggle to tell which one drove results.
- Between a media variable and the outcome: high correlation may be expected, but should still be reviewed in Diagnostics and Graph.
Know when you're ready to move on
Continue to Diagnostics when the following are consistent with your source data and business context:
- Selected period
- Totals
- Variable classifications
- Time-series patterns
Frequently Asked Questions
Why should I review Data before looking at results?
Your model's results are only as reliable as the data behind them. Reviewing Data first helps you catch missing values, misclassified variables, or unexpected totals before they affect your analysis.
What should I do if total spend doesn't match my source data?
Investigate before continuing. Check whether a channel is missing, whether the date range matches your intended analysis period, and whether spend has been aggregated correctly.
Why does a sharp shift appear in my time-series trends?
Sharp shifts usually trace back to tracking or taxonomy changes, such as a renamed campaign or a change in how a channel is recorded.
Can I compare several variables on the same chart?
Yes. You can plot multiple variables at once to compare their timing or scale, and use the comparison period for added context.
If two variables move together, does one cause the other?
Not necessarily. Similar movement can be useful context, but correlation alone does not establish causality.
Why does variable classification matter?
Paid, organic, contextual, halo, and outcome variables each play a different role in the model and in contribution reporting. A misclassified variable can lead to incorrect results.
What is the difference between Raw Input and Transformed correlations?
Raw Input shows correlations between variables as they appear in your data. Transformed shows correlations after the model's transformations are applied, where those results are available.
What should I do if two paid channels are highly correlated?
Be aware that their individual effects may be harder to separate. Review how the model handles them in Diagnostics and Graph.
When am I ready to move on to Diagnostics?
When the selected period, totals, variable classifications, and time-series patterns are consistent with your source data and business context.
Related Articles
Updated about 1 hour ago