Intrepreting a plan
Understand recommendations, generate multiple scenarios and leverage the budget worksheet
Once you configure channel parameters for a new budget plan, you are directed to the Plan Analysis page. This is your primary workspace for analyzing budget scenarios, understanding forecasted outcomes, and viewing specific budget recommendations to optimize your marketing spend.
Key Metrics
On the left side of the page, you'll find summary cards for each scenario you've created. When you select a scenario, the main dashboard updates to show a detailed view of its key metrics, comparing your current standing with the model's forecast.
This section is split into 'Current' (forecast base period) and 'Forecasted' (the scenario's prediction) metrics
- Current Budget: Your total baseline marketing budget.
- Current Revenue: The total revenue associated with your baseline budget.
- Current Incremental ROAS (iROAS): The incremental revenue generated only by your ad spend in your current plan.
- Current ROAS: The overall Return On Ad Spend for your current plan.
- Planned Budget: The total budget you've allocated for this specific scenario.
- Forecasted Total Revenue: The total revenue the model predicts you will generate with the
Planned Budget. - Forecasted Incremental ROAS (iROAS): The predicted incremental revenue generated only by your ad spend in this scenario.
- Forecasted ROAS: The predicted overall Return On Ad Spend for this scenario.
ROAS vs. iROAS: What's the Difference?It's important to understand the distinction between these two metrics:
iROAS measures the return generated purely from your advertising investment.
ROAS is a blended metric that calculates the return based on your total revenue, which includes both the baseline revenue and the additional revenue generated by your ad spend.
Recommendations Tab
This tab provides actionable insights by comparing your current budget allocation against an optimized version. The charts visualize where you should shift your investments to maximize returns.
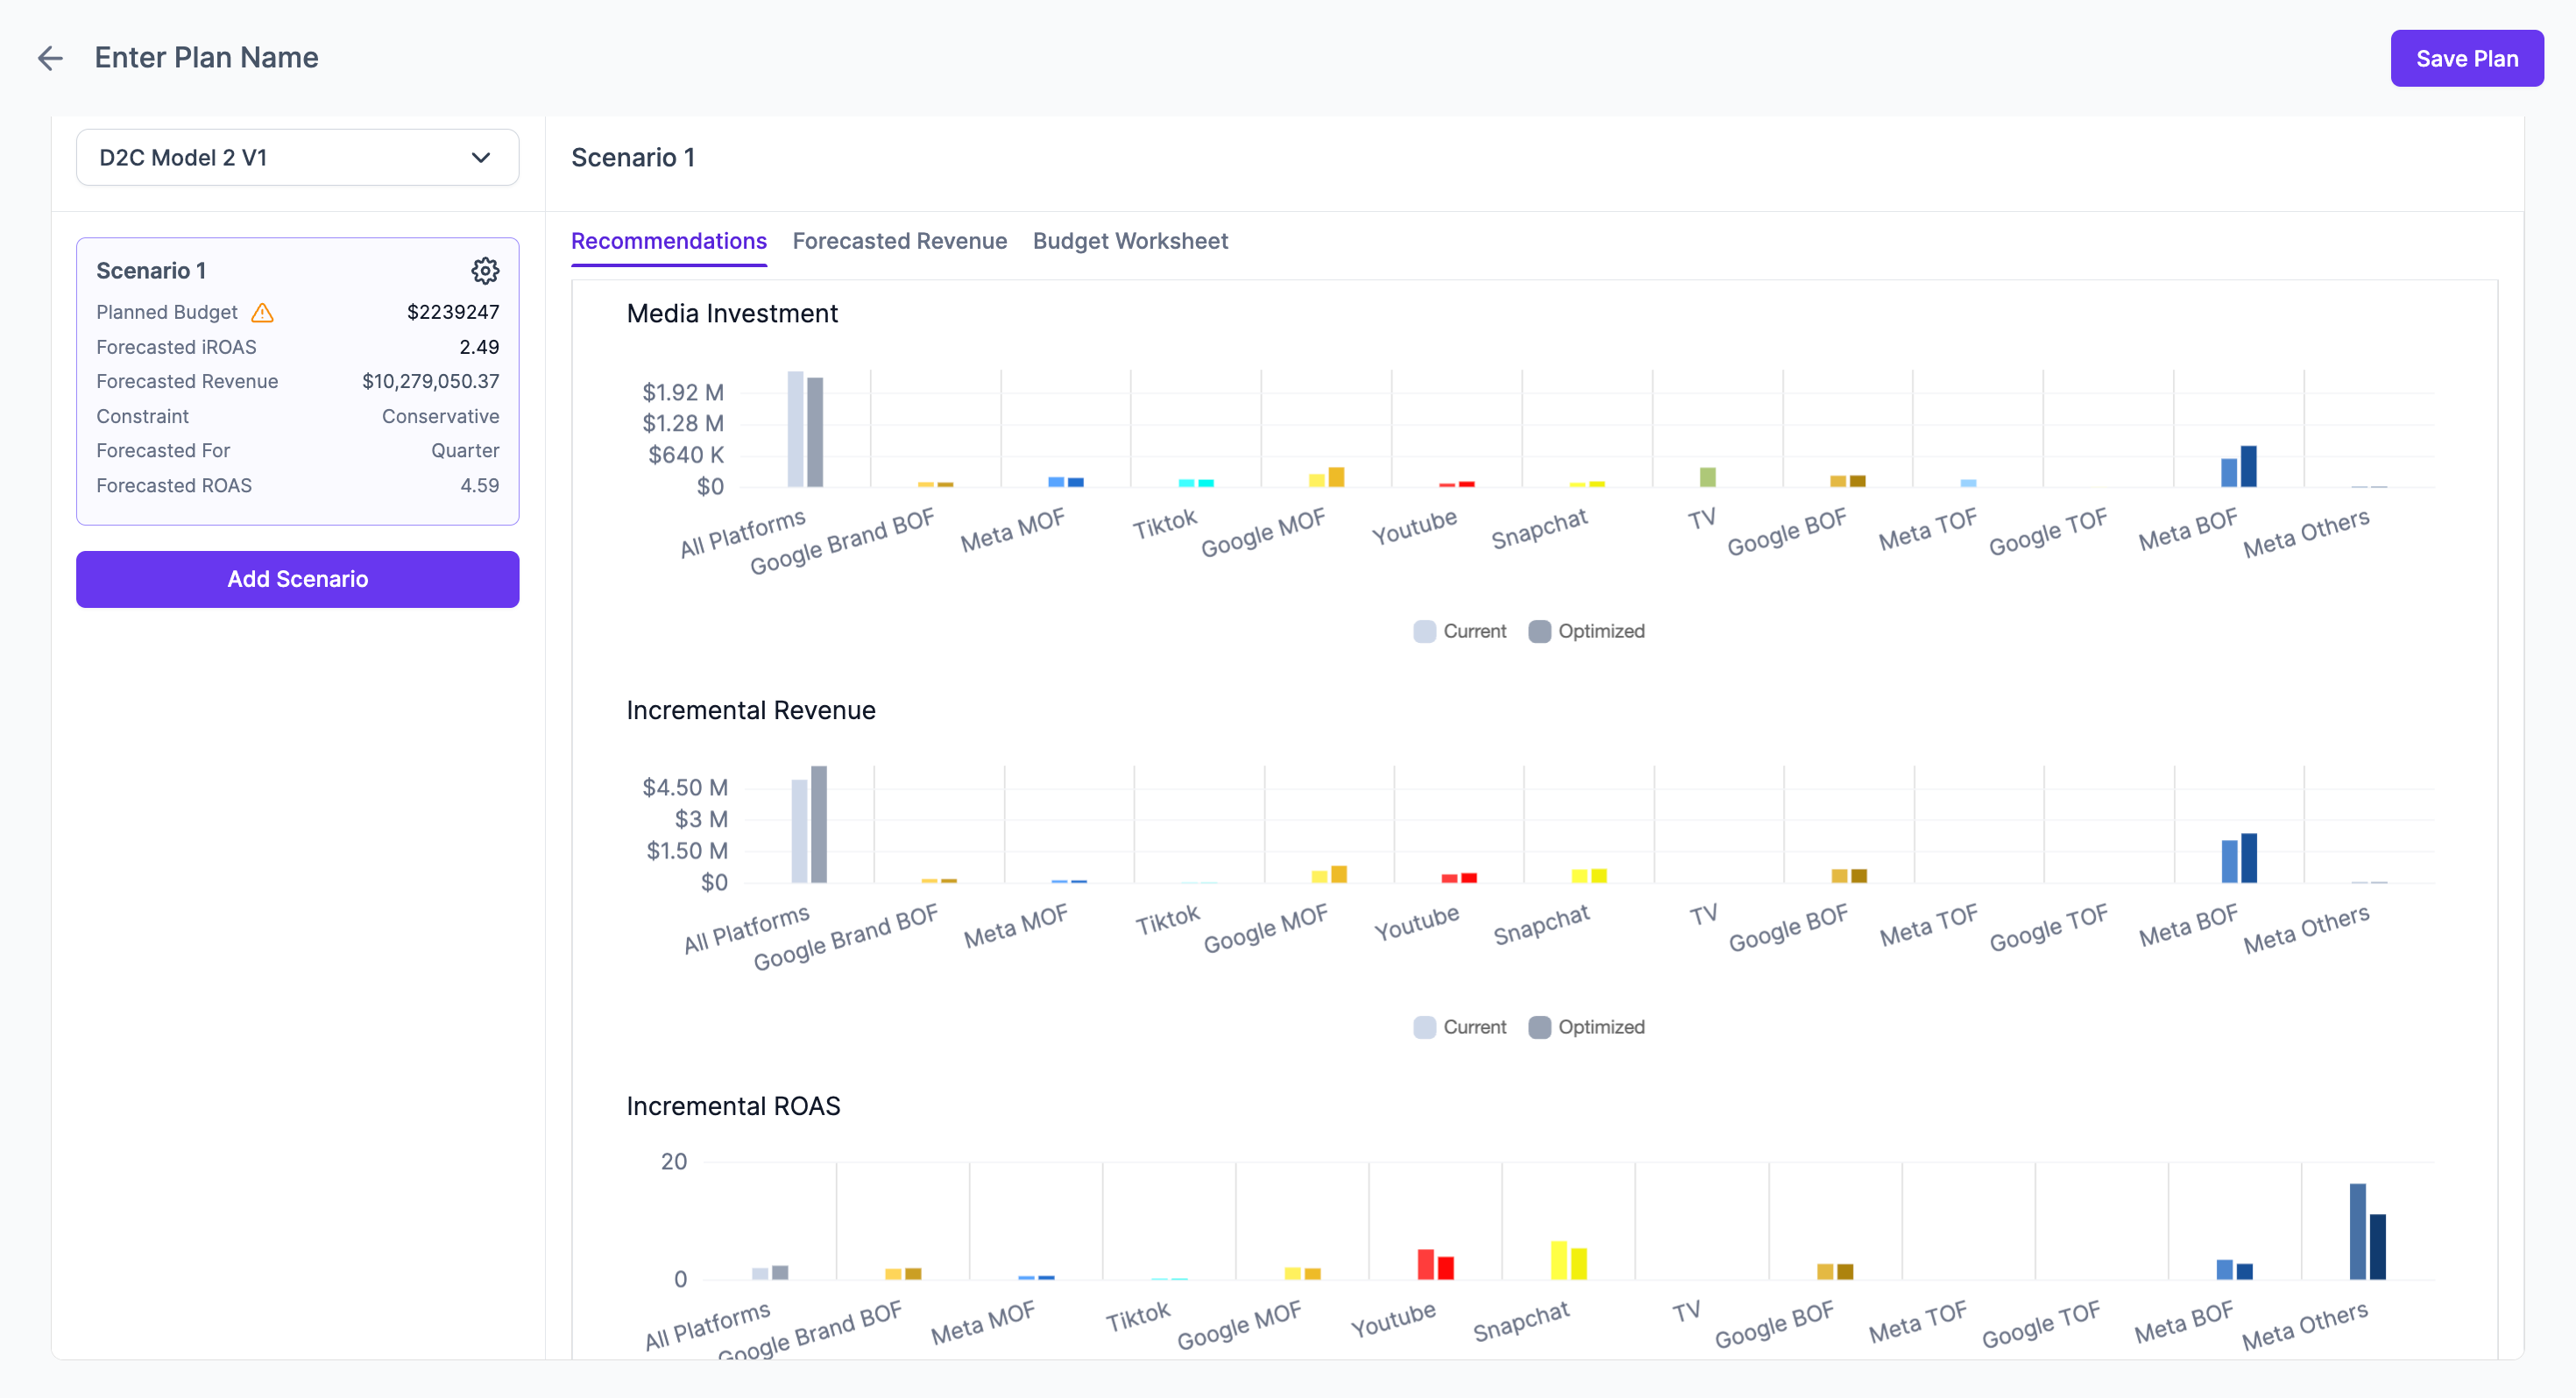
Media Investment
This chart shows the recommended media budget for each platform compared to your current plan.
-
Current (light blue bar): Your existing or initial budget allocation.
-
Optimized (dark blue bar): The platform's recommended budget to achieve your goals.
Use this to see which channels are over-funded and which have room for more investment.
Incremental Revenue
This chart shows the forecasted incremental revenue from each platform. By comparing the 'Current' and 'Optimized' bars, you can see how the recommended budget shifts are expected to impact the revenue driven by each channel.
Incremental ROAS
This chart illustrates the incremental Return On Ad Spend for each platform. It helps you identify which channels are most efficient and how that efficiency changes with the optimized budget.
Forecasted Revenue Tab
This tab provides a more detailed, time-based view of the revenue forecast for the selected scenario.
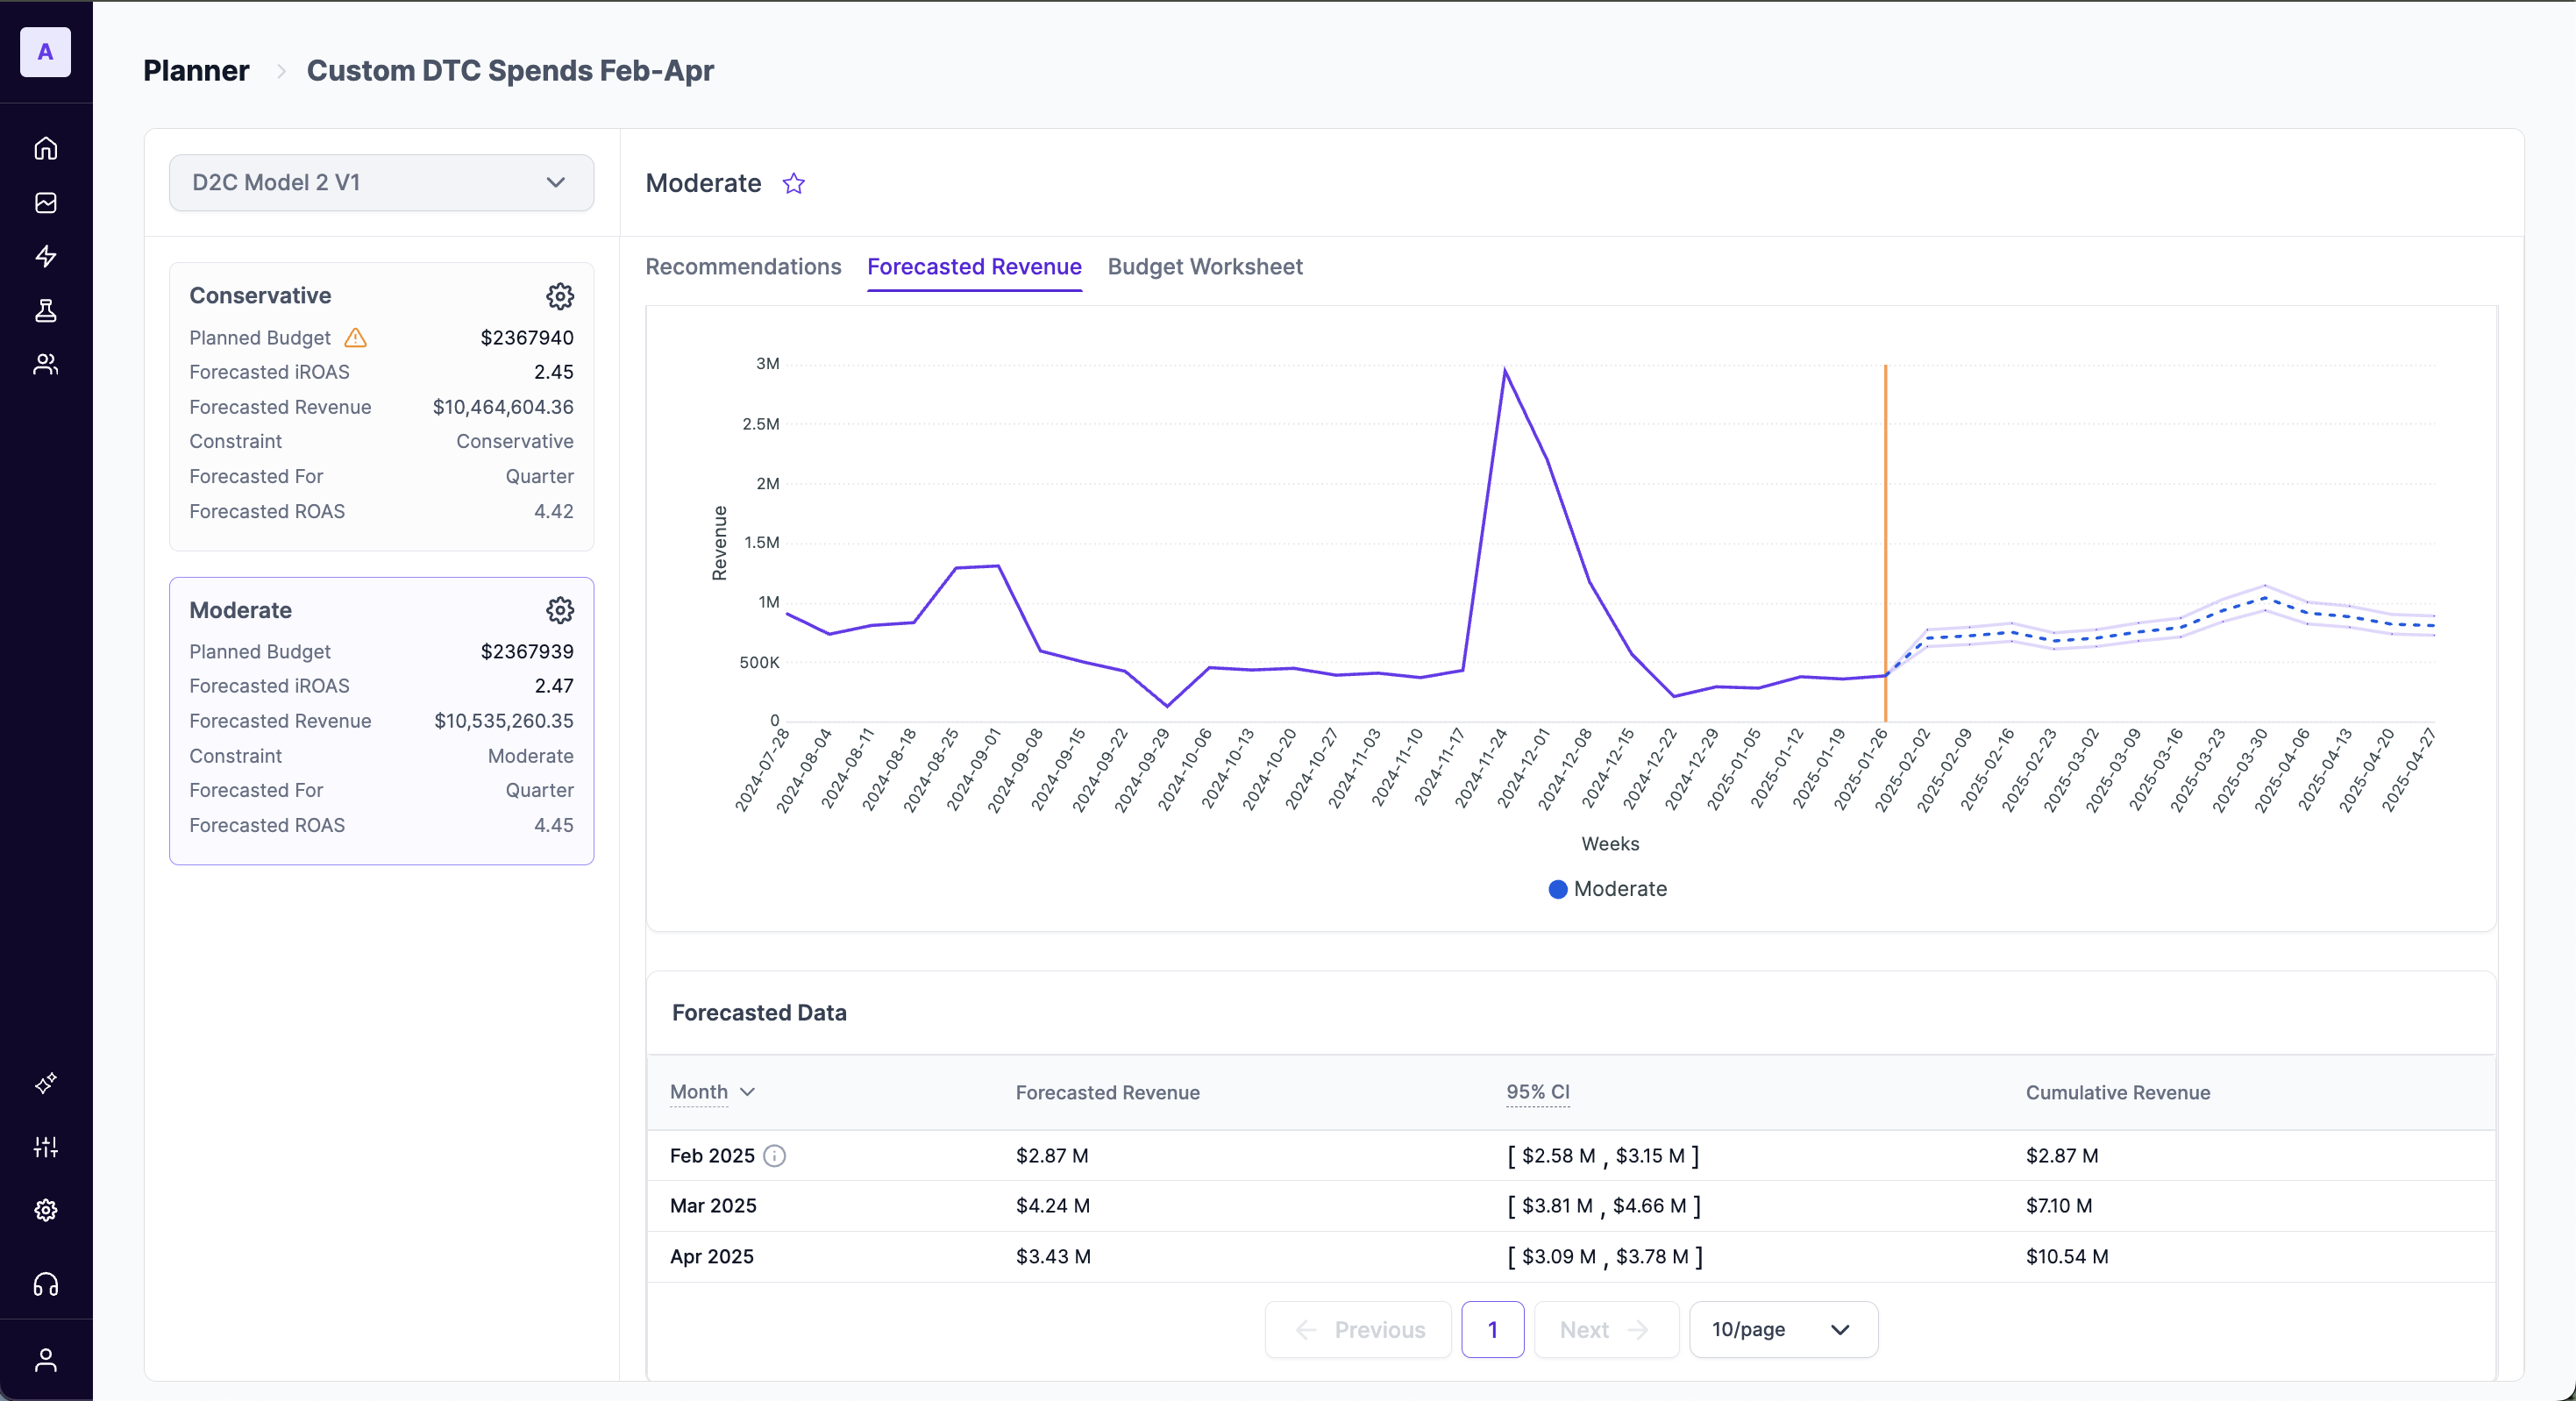
Forecasted Trend
The line chart visualizes the expected revenue trend over the duration of your plan. This allows you to anticipate peaks and troughs in performance, which can be useful for aligning marketing activities with sales cycles. The shaded region around the line represents the 95% confidence interval of the forecast.
Forecasted Data
The table below the chart provides a summary of the forecasted revenue broken down by the forecast period intervals. It also explicitly states the 95% Confidence Interval (CI), giving you a probable range for the forecasted revenue ([Lower Bound] - [Upper Bound]) and the cumulative revenue achieved at the ending of each month in the forecast period.
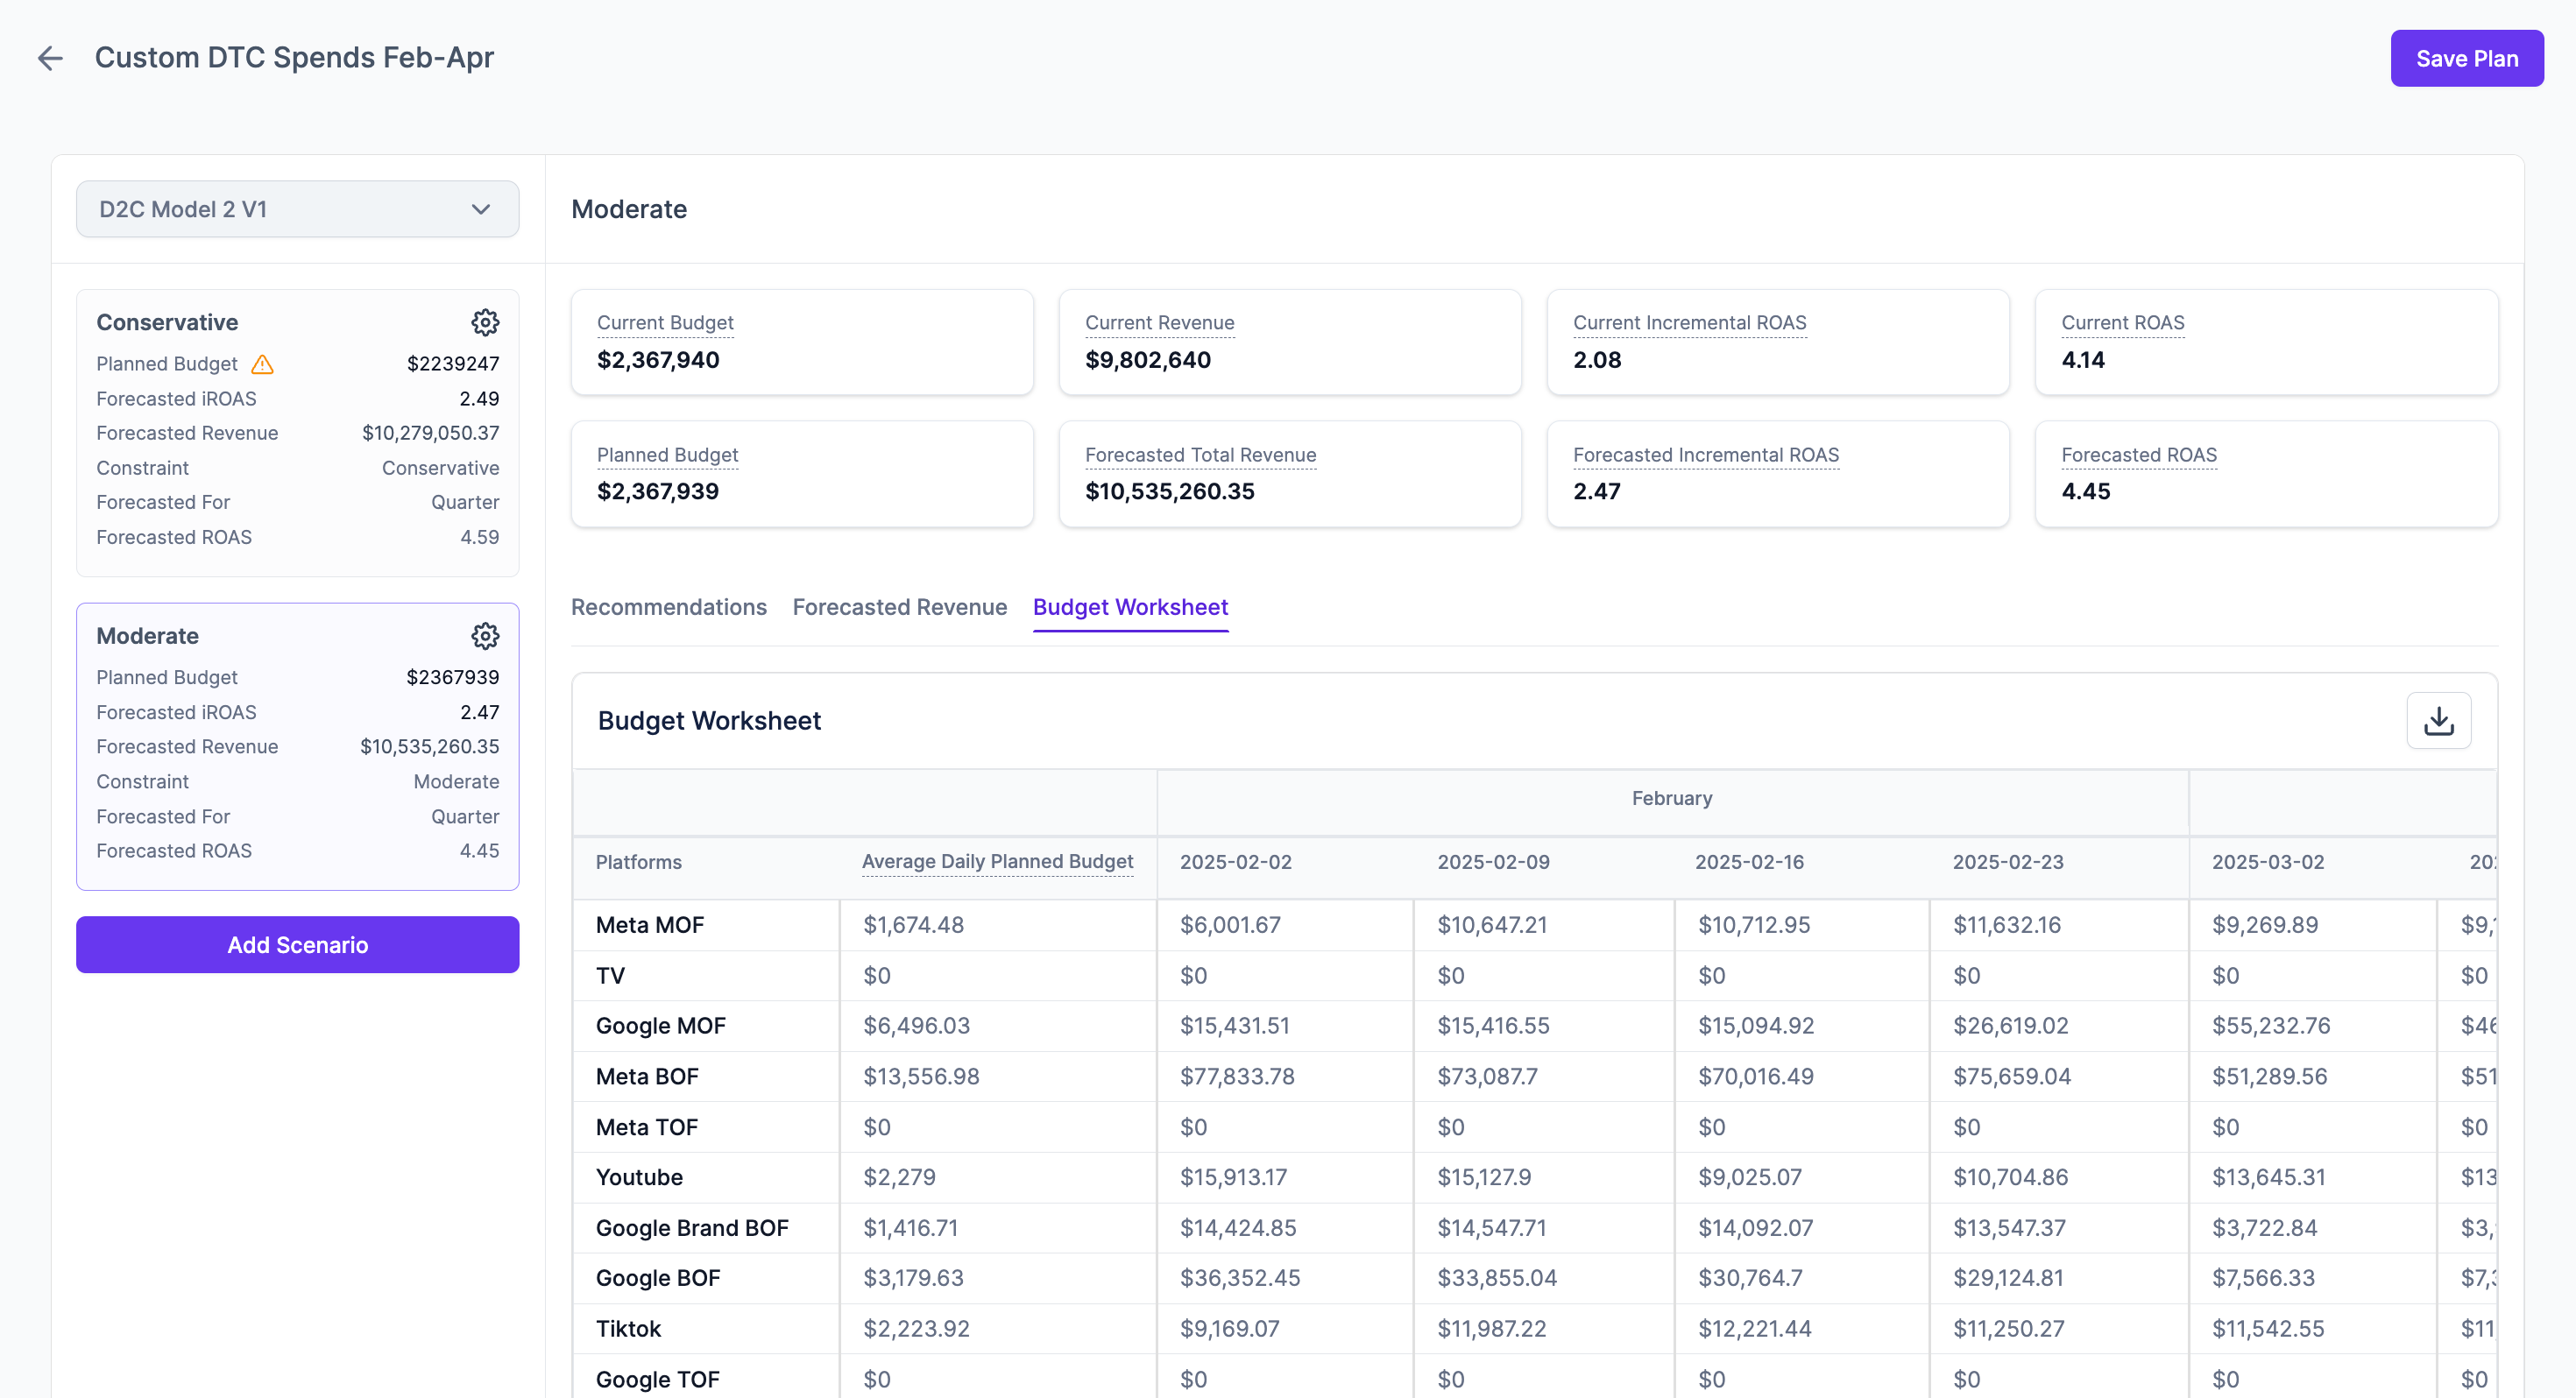
Budget Worksheet Tab
The Budget Worksheet gives you a granular, week-by-week breakdown of the planned budget for each platform. This is the tactical output of your strategic plan.
The worksheet contains
-
Platforms: A list of your marketing channels. These are the specific platforms the underlying Media Mix Model (MMM) takes into account when making revenue predictions.
-
Average Daily Planned Budget: The average amount to be spent per day on a given platform, based on the scenario.
-
Weekly Breakdowns: Columns for each week in your plan's period, showing the exact budget allocated for that week.
Download Your WorksheetClick the download icon in the top-right corner of the worksheet to export the data as a CSV file. This is useful for sharing with your team or importing into other tools.
Working with Multiple Scenarios
The planner's power lies in its ability to create and compare multiple scenarios. You can model different outcomes based on different budgets or strategic constraints (e.g., a "Conservative" plan vs. a "Moderate" plan).
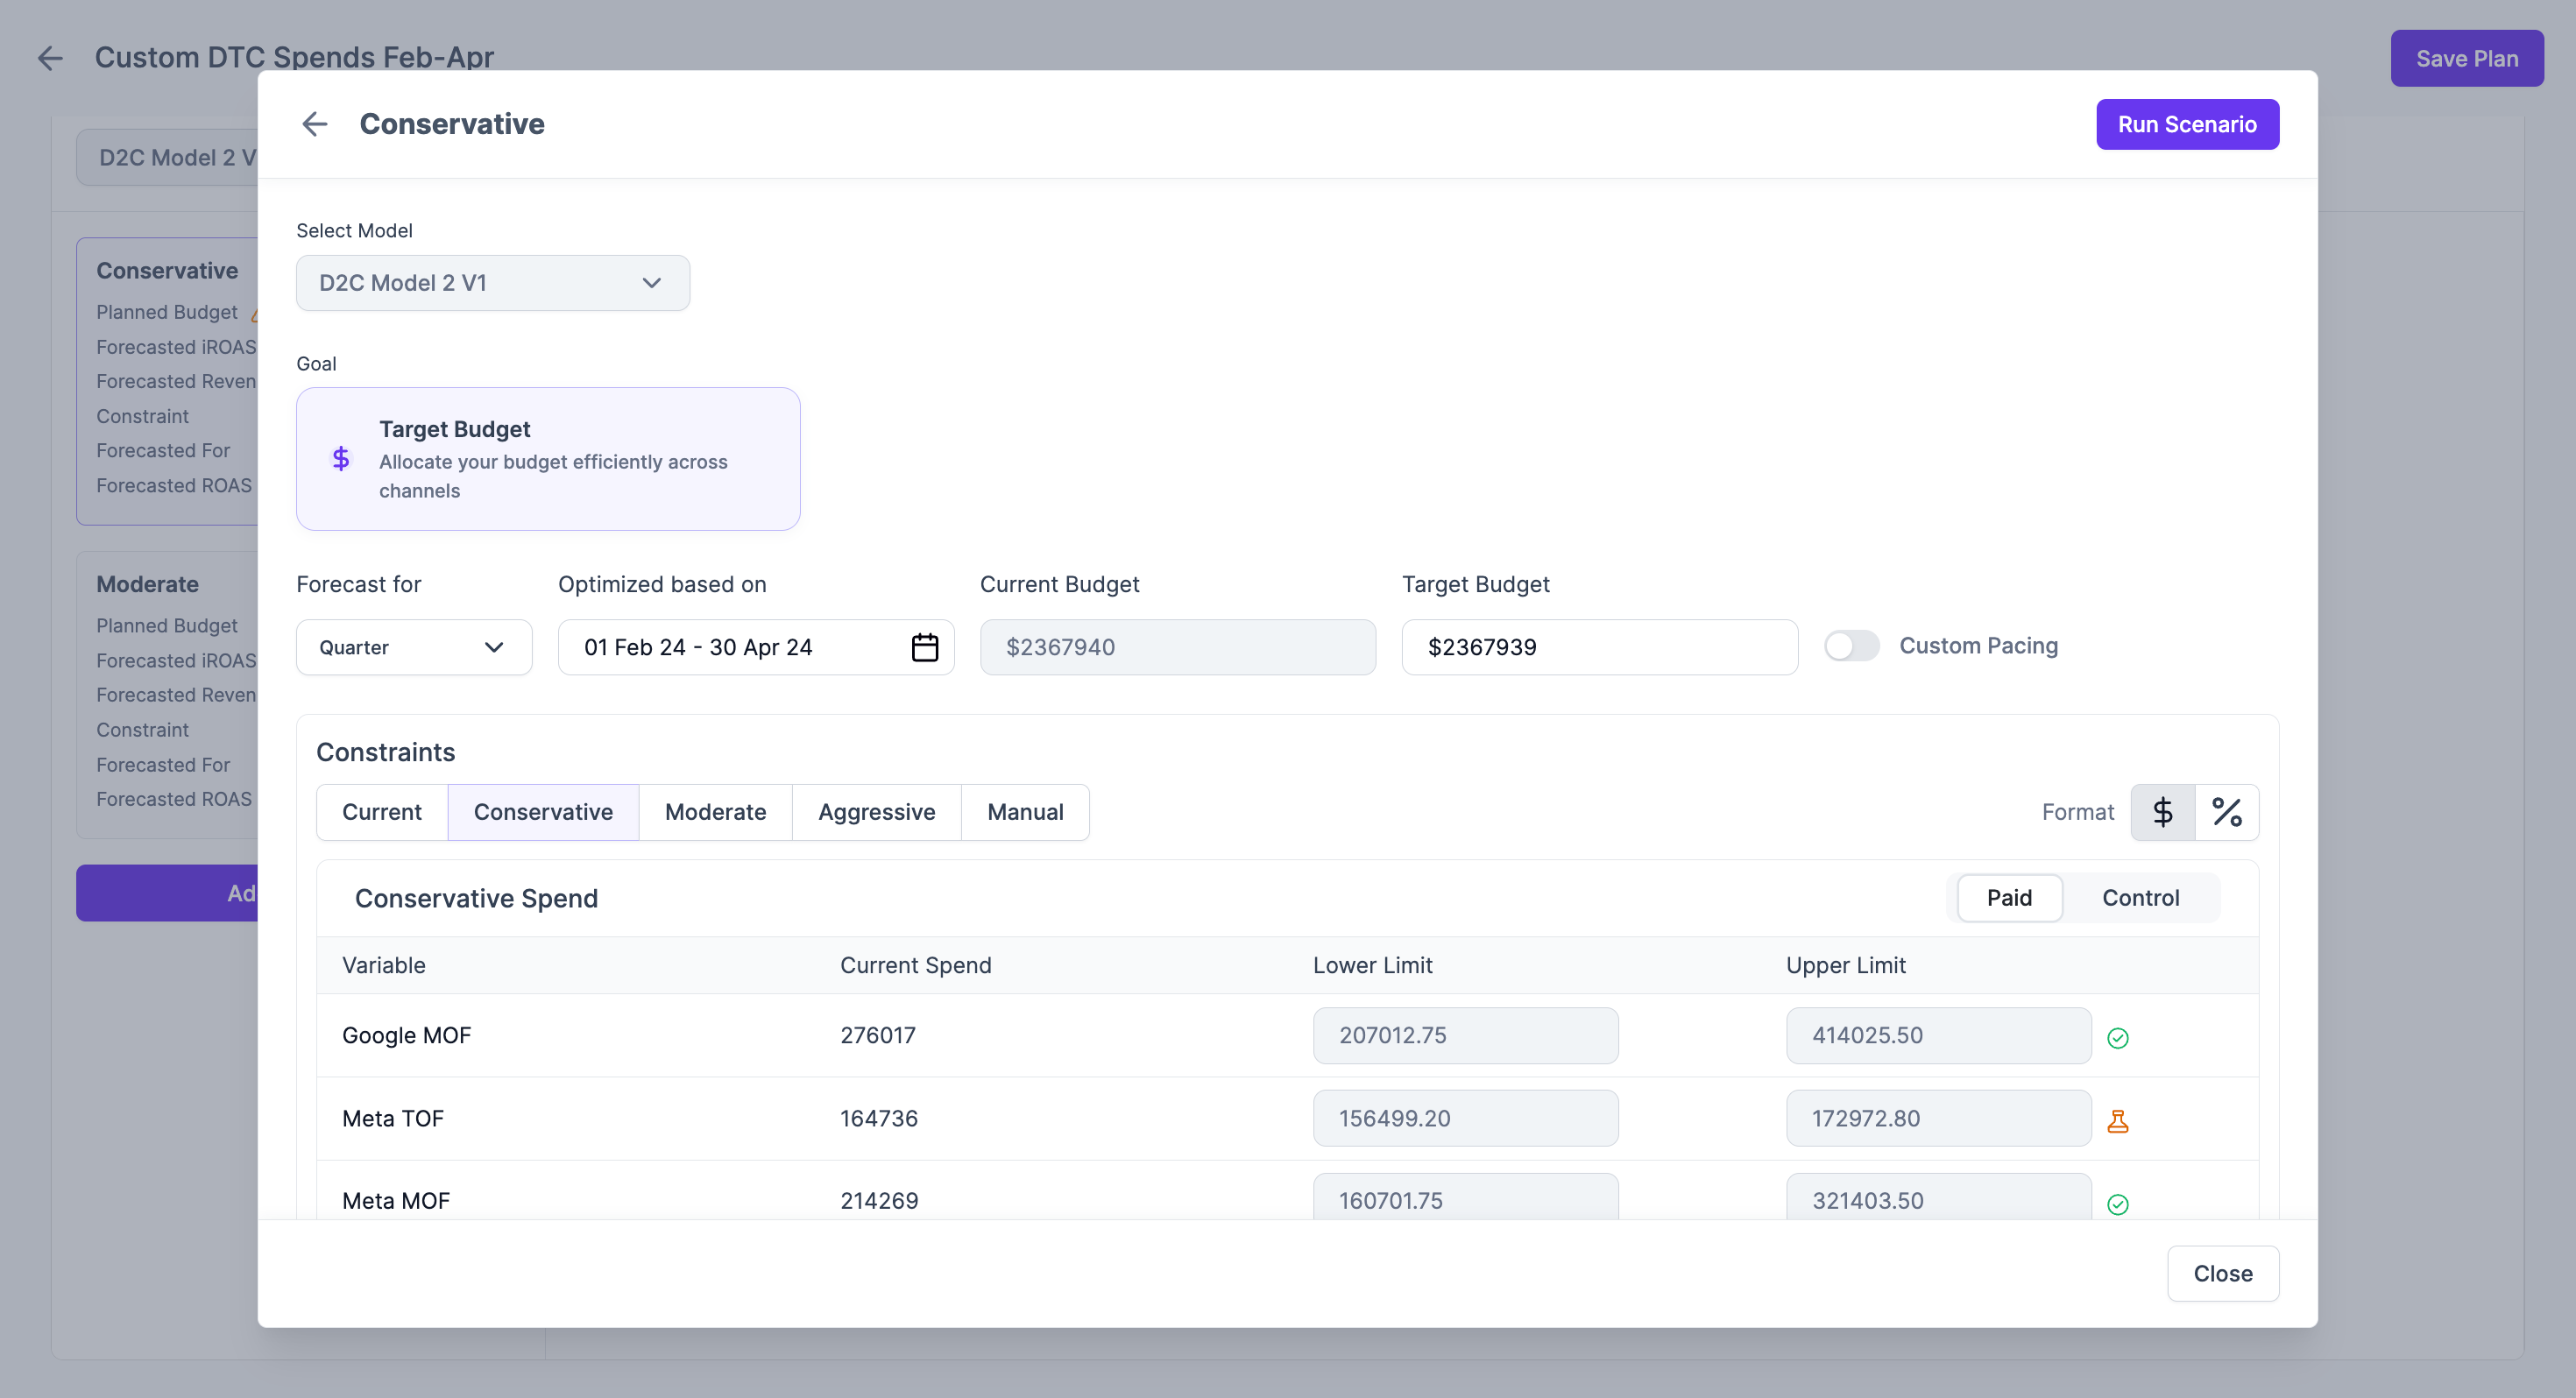
- Adding a Scenario: Click the Add Scenario button to create a new budget plan with different parameters.
- Comparing Scenarios: Simply click on a different scenario card in the left-hand panel. All the data in the Recommendations, Forecasted Revenue, and Budget Worksheet tabs will instantly update to reflect the selected scenario, allowing for quick and easy comparison.
Saving Your Plan
Once you have analyzed your scenarios and are ready to move forward, click the Save Plan button in the top-right corner. This will save all your configured scenarios and their corresponding analyses.
Once a plan has been saved, it cannot be edited. The plan contains the multiple scenarios which were generated before hitting the 'Save Plan' button .
Updated 10 months ago