Purchases
The Purchases tab in Attribution features three charts—Orders, Products, and Geo Insights. Here's how each component contributes:
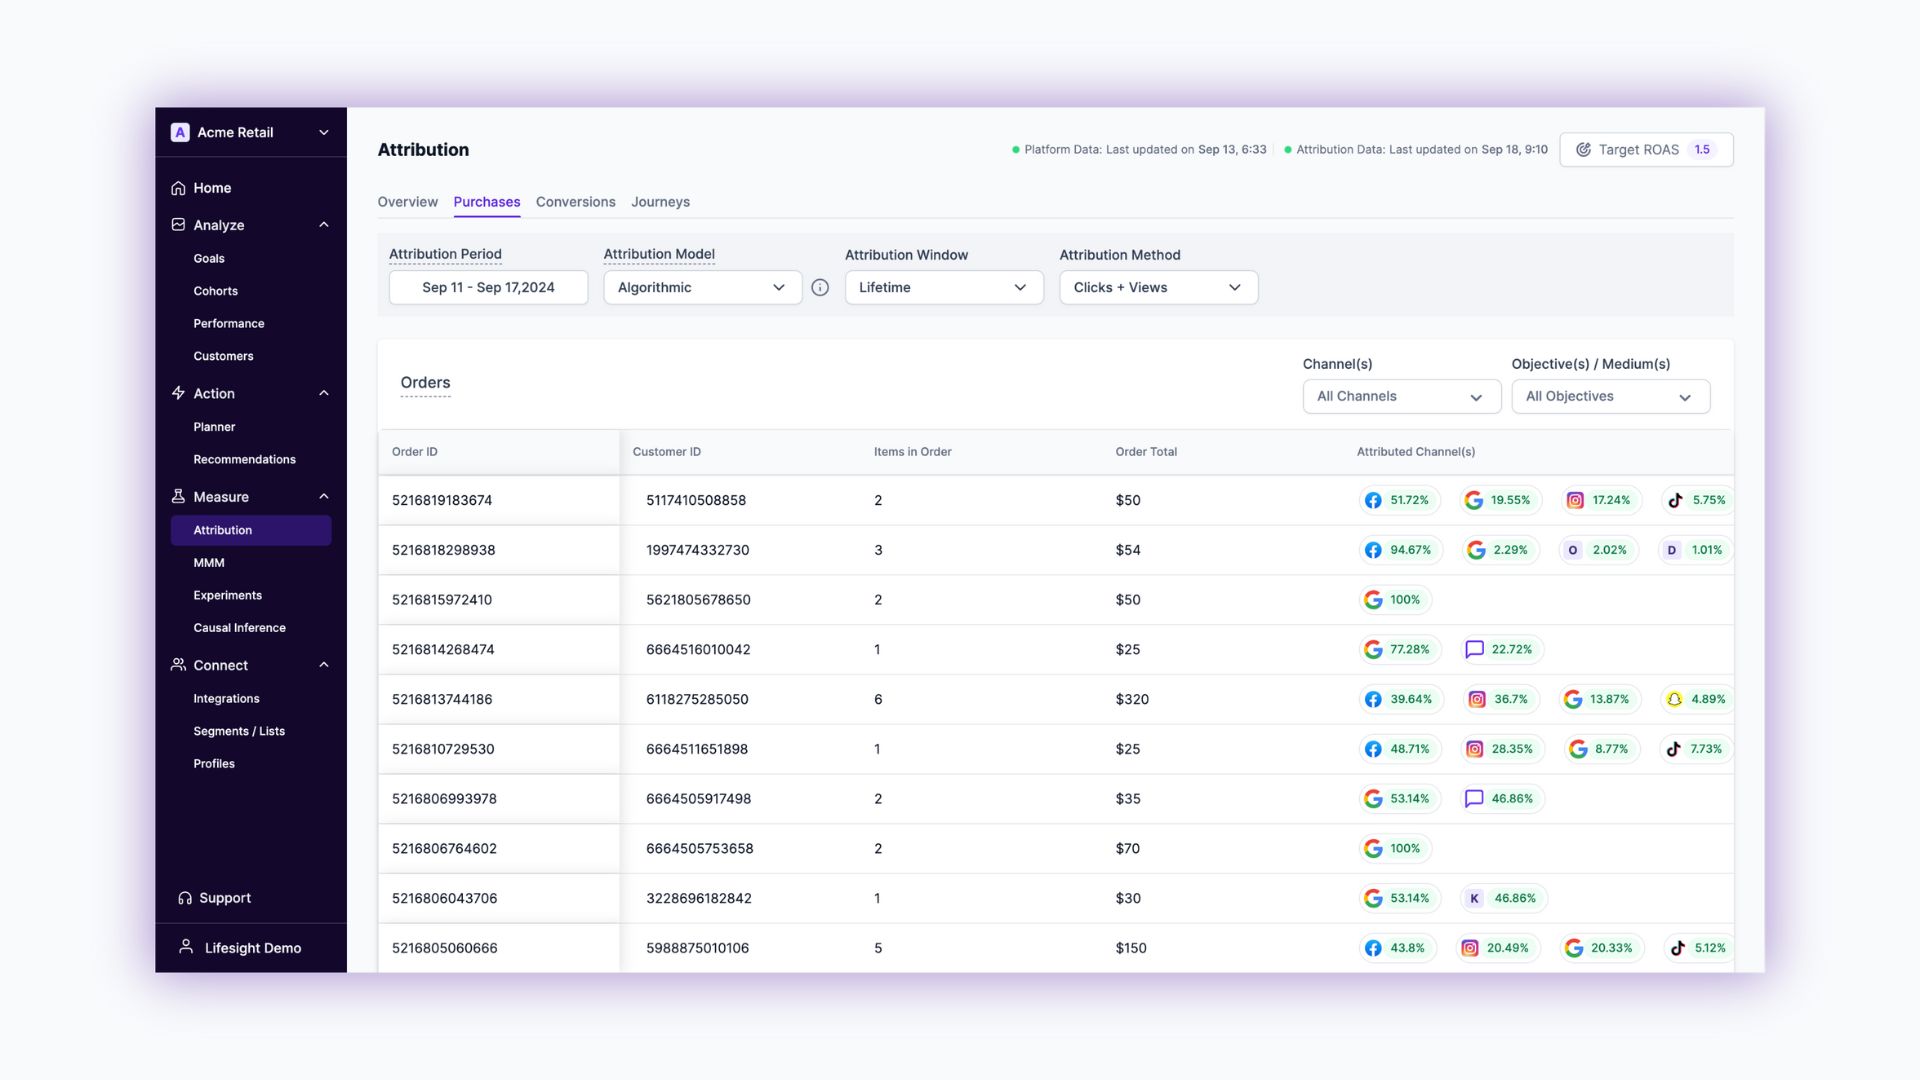
Users can filter their data using Attribution Period, Attribution Model, Attribution Window, Attribution Method, Channel Filter and Objective/Medium.
- Channels Filter: This allows you to categorize orders based on the UTM source value. Examples include Facebook, Google, among others. Utilizing this filter will enable you to understand the performance of different marketing channels effectively.
- Objective(s)/Medium Filter: Employ this filter to sort orders by their UTM Medium values. This feature is particularly useful in analyzing the medium through which the customers were acquired, such as through specific advertising objectives or campaigns.
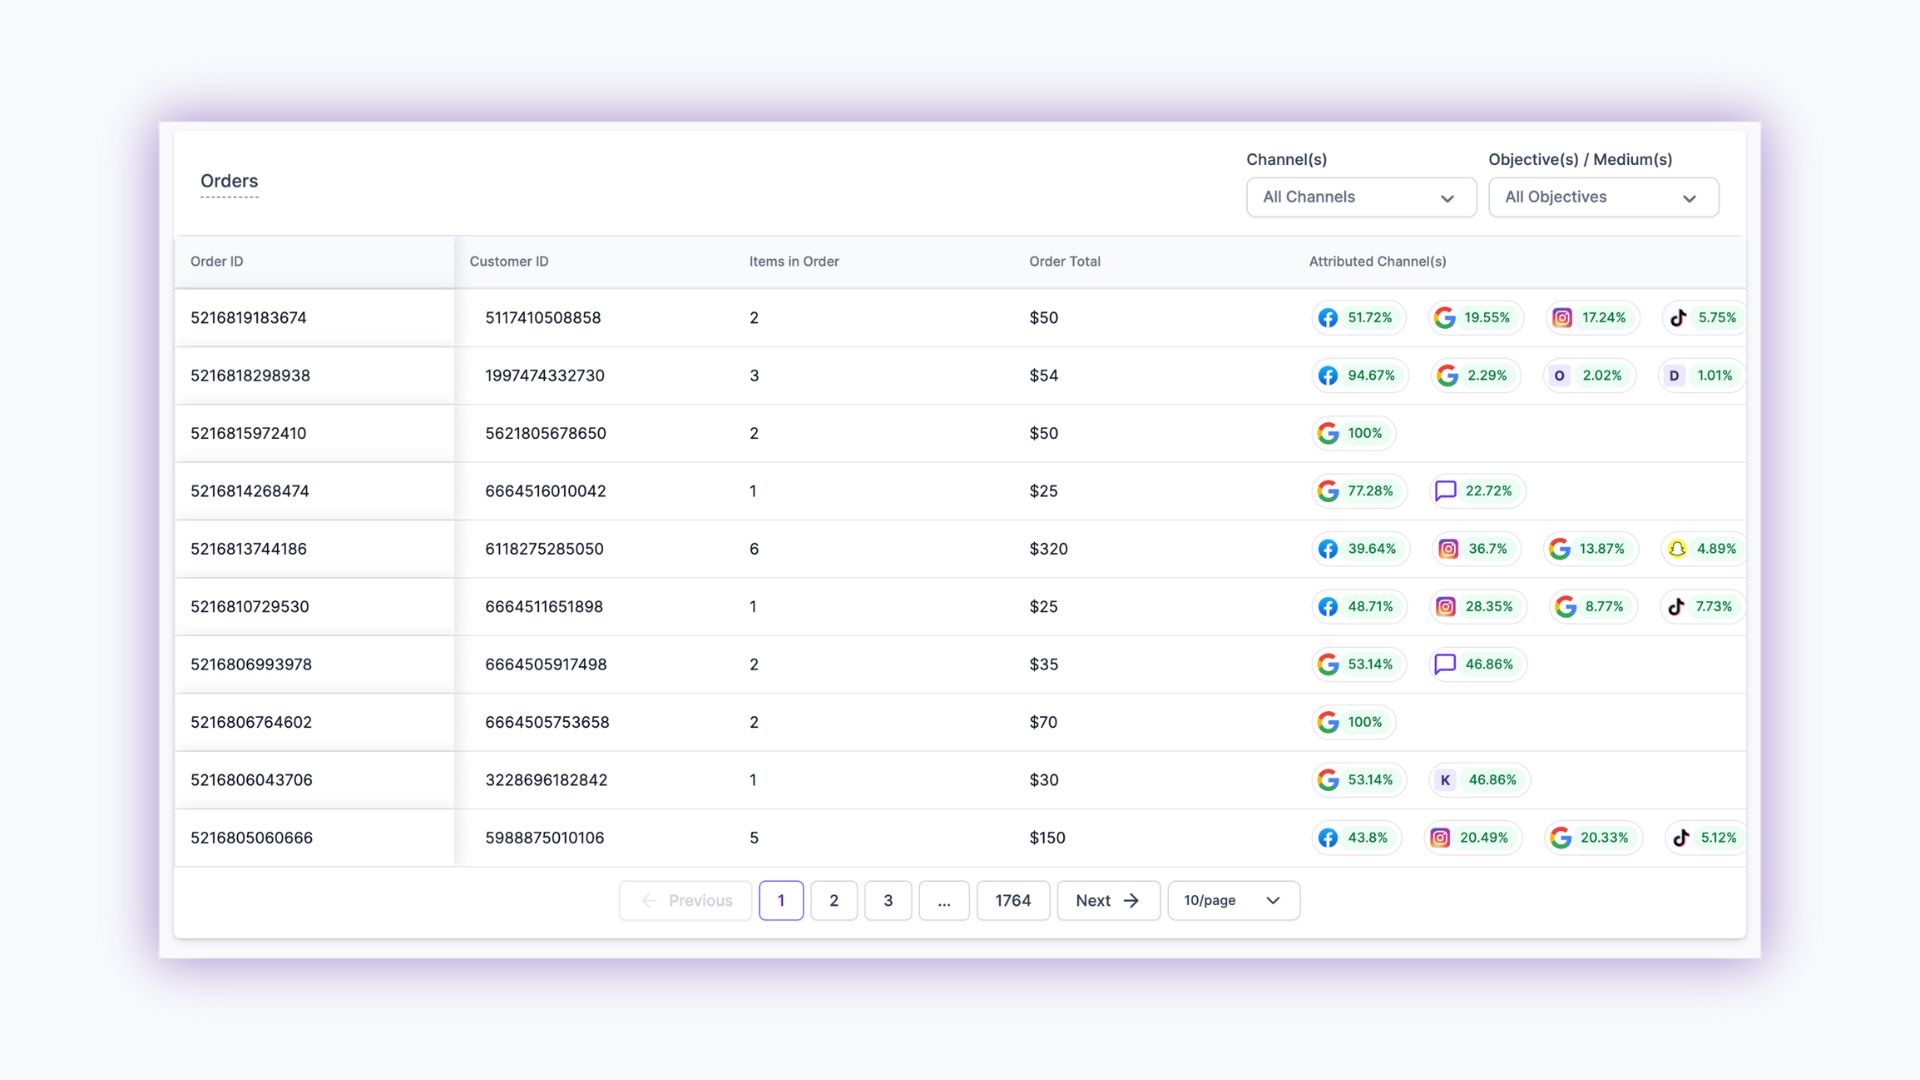
Orders
Attributed Channels: Each order is associated with its respective marketing channel(s), based on the filters applied. It provides clarity on which channels are driving your sales. It presents a detailed breakdown of the credit allocation for each advertising channel. For example, an order worth $999 might show a split such as 77.8% for CPS and 22.2% for Google, depending on the global filters set. This insight is vital for understanding the ROI of various ad channels.
Order Quantities and Values: The table lists the total number of items and the total value for each order, giving you a clear picture of order size and worth.
Order Sorting: By default, orders are arranged in descending order of their timestamp, ensuring that the most recent orders are displayed first for your convenience.
Customer ID: For further insights, the Customer IDs are interactive. Clicking on it will redirect you to the Orders tab inside the Profile Insights page.
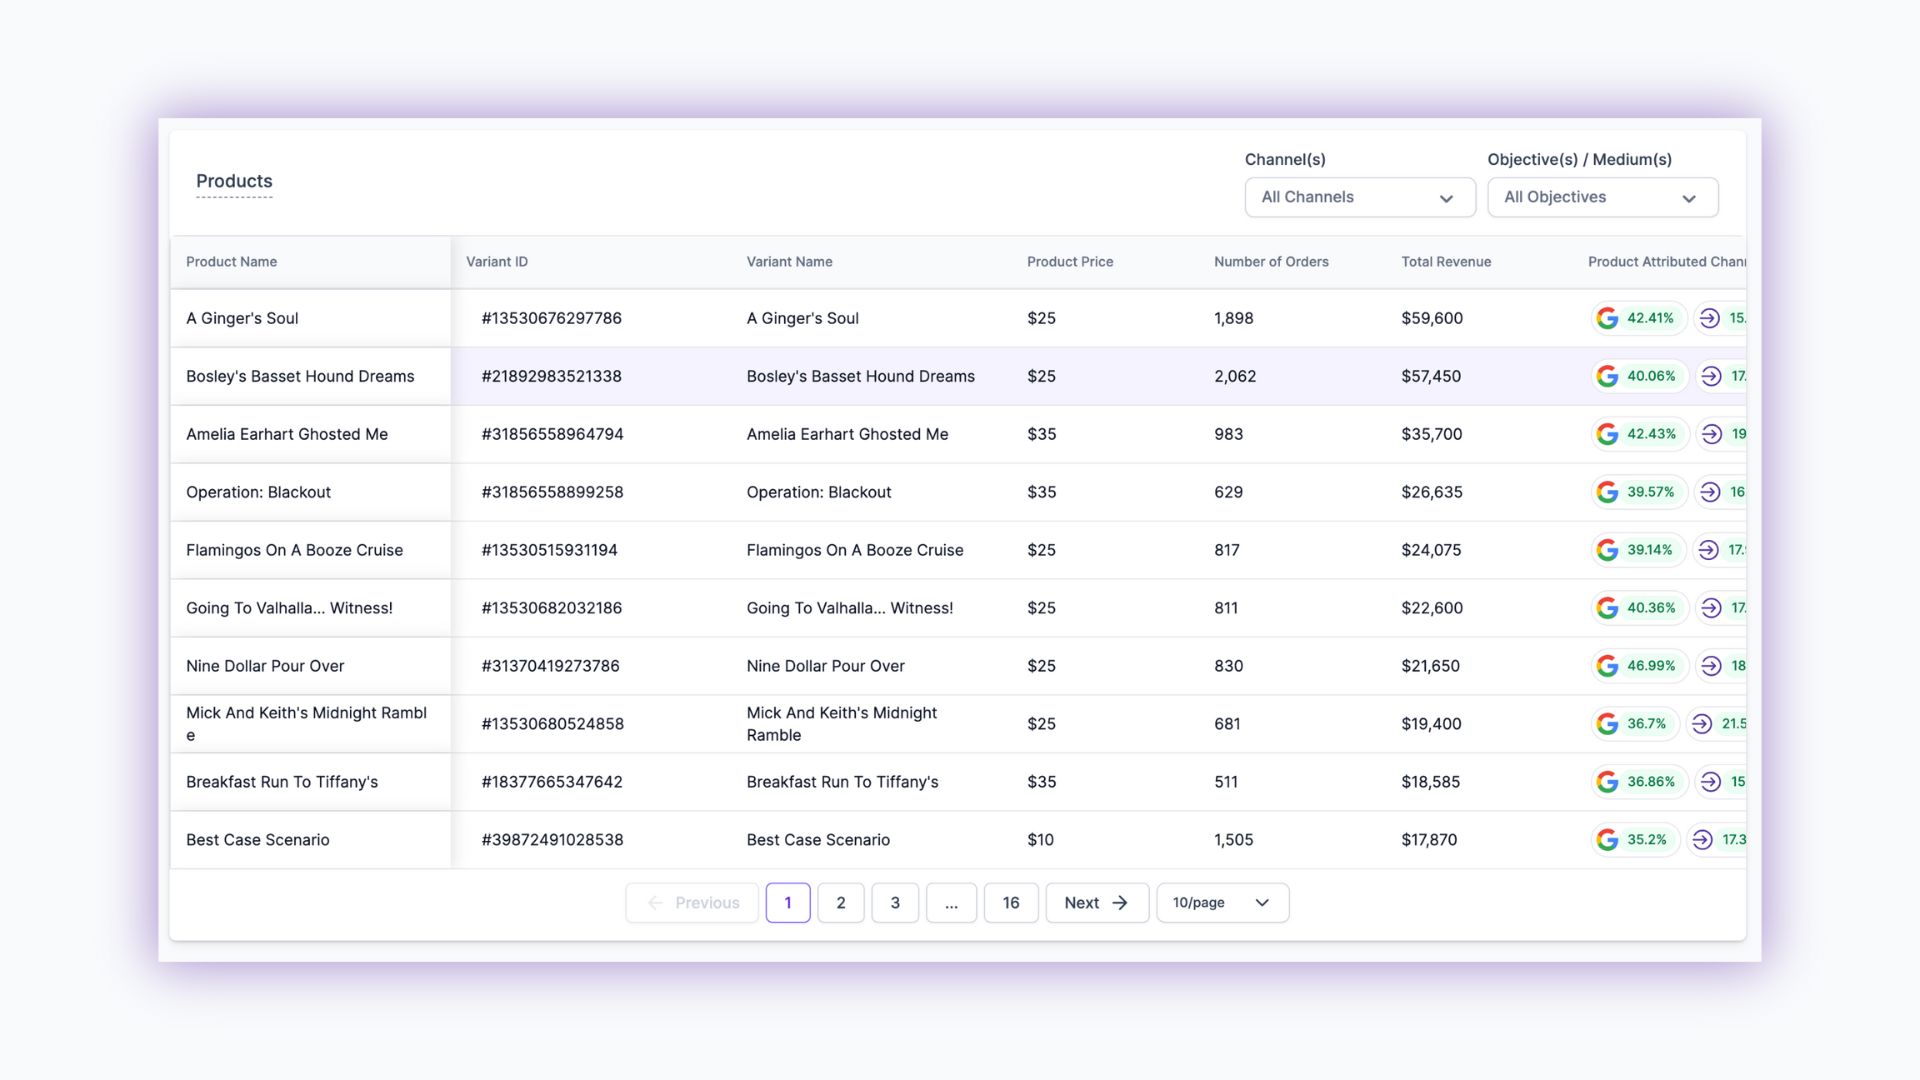
Products
Product Price: Lists individual prices for each product and variant, aiding in performance assessment.
Revenue and Orders: Shows total revenue and the number of orders for each variant, key for sales analysis.
Attributed Channel: The final column reveals the percentage of credit allocated to each advertising channel, according to global filters, providing insights into advertising effectiveness.
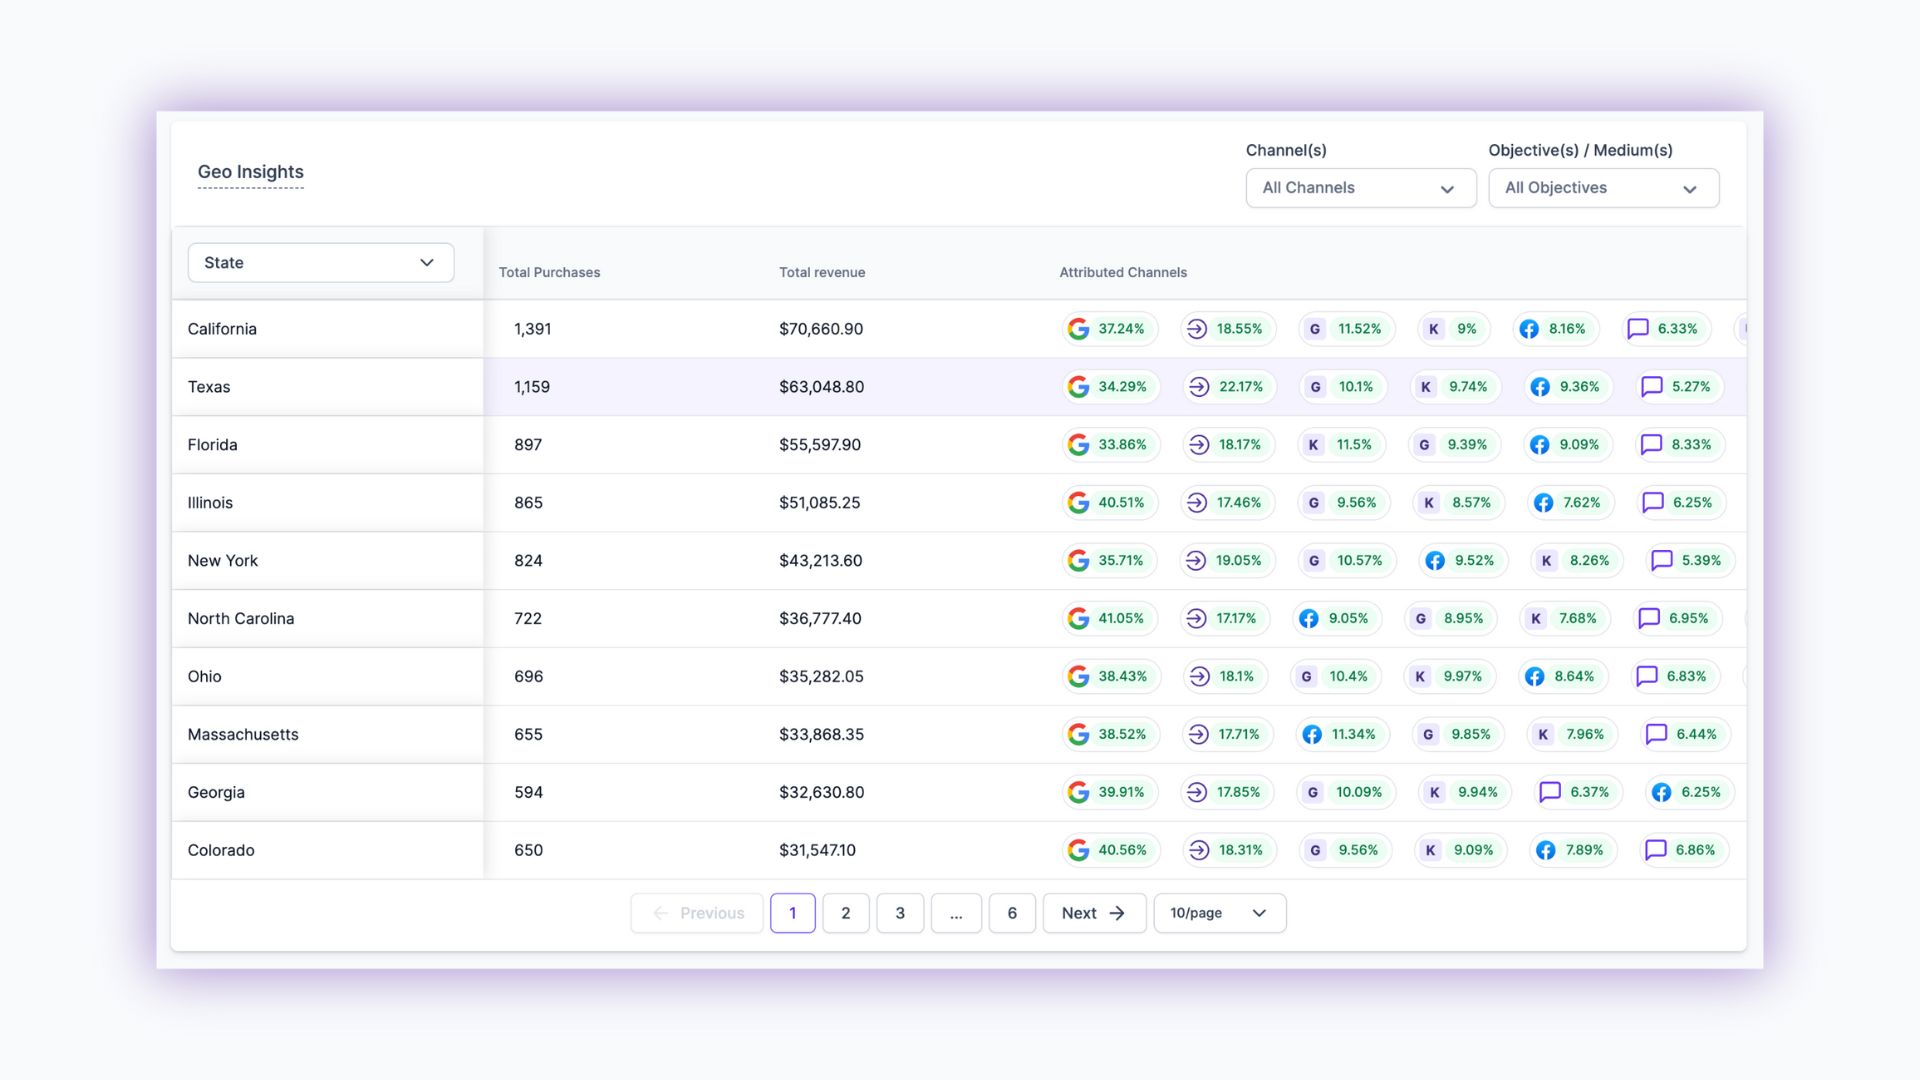
Geo Insights
Total Purchases: Shows the total number of purchases made in each geographical area.
Total Revenue: Details the total revenue generated from each State/City.
Attributed Channel: The last column, indicates the percentage of credit allocated to each advertising channel for each State/City, according to global filters, providing insights into advertising effectiveness.
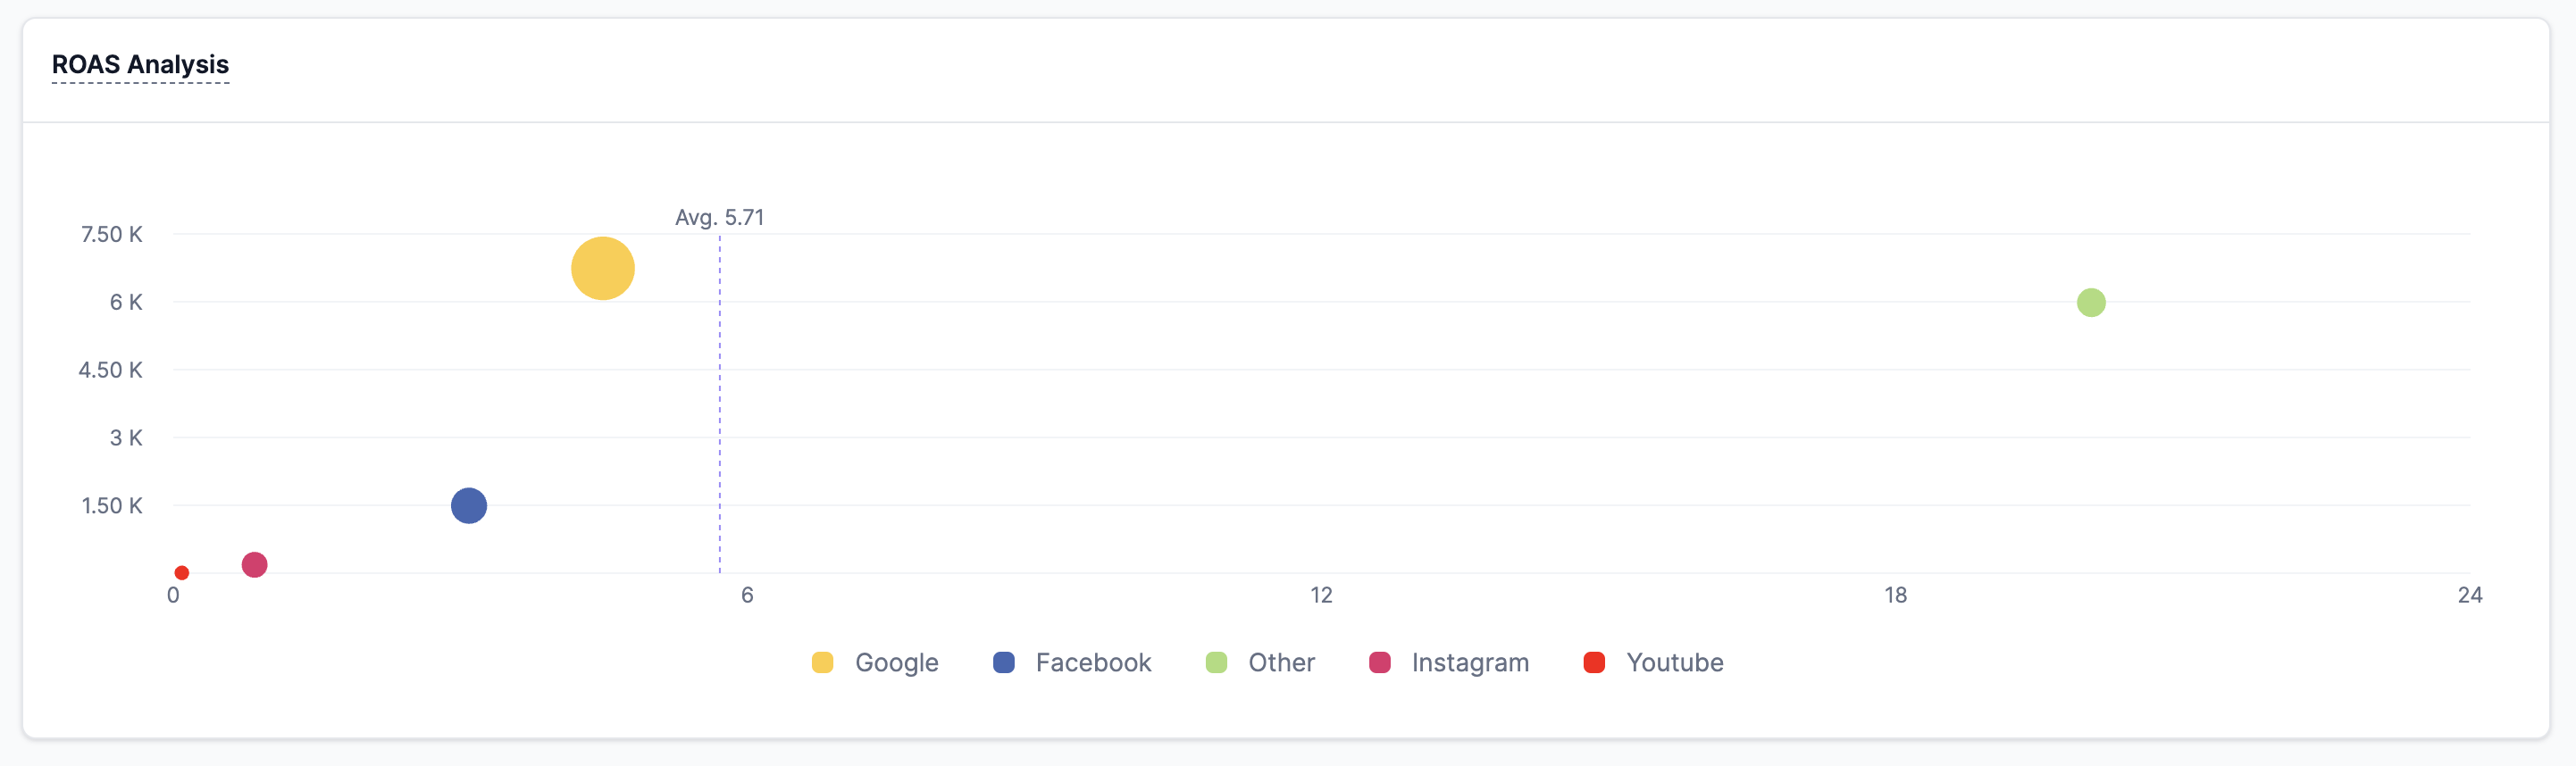
ROAS analysis
Return on Advertising Spend Analysis displays the efficiency of your ad campaigns across various platforms. The chart shows the average ROAS value (represented by the dashed line) and individual performance metrics for each advertising channel. Hover over the data points to see detailed ROAS values for each channel.
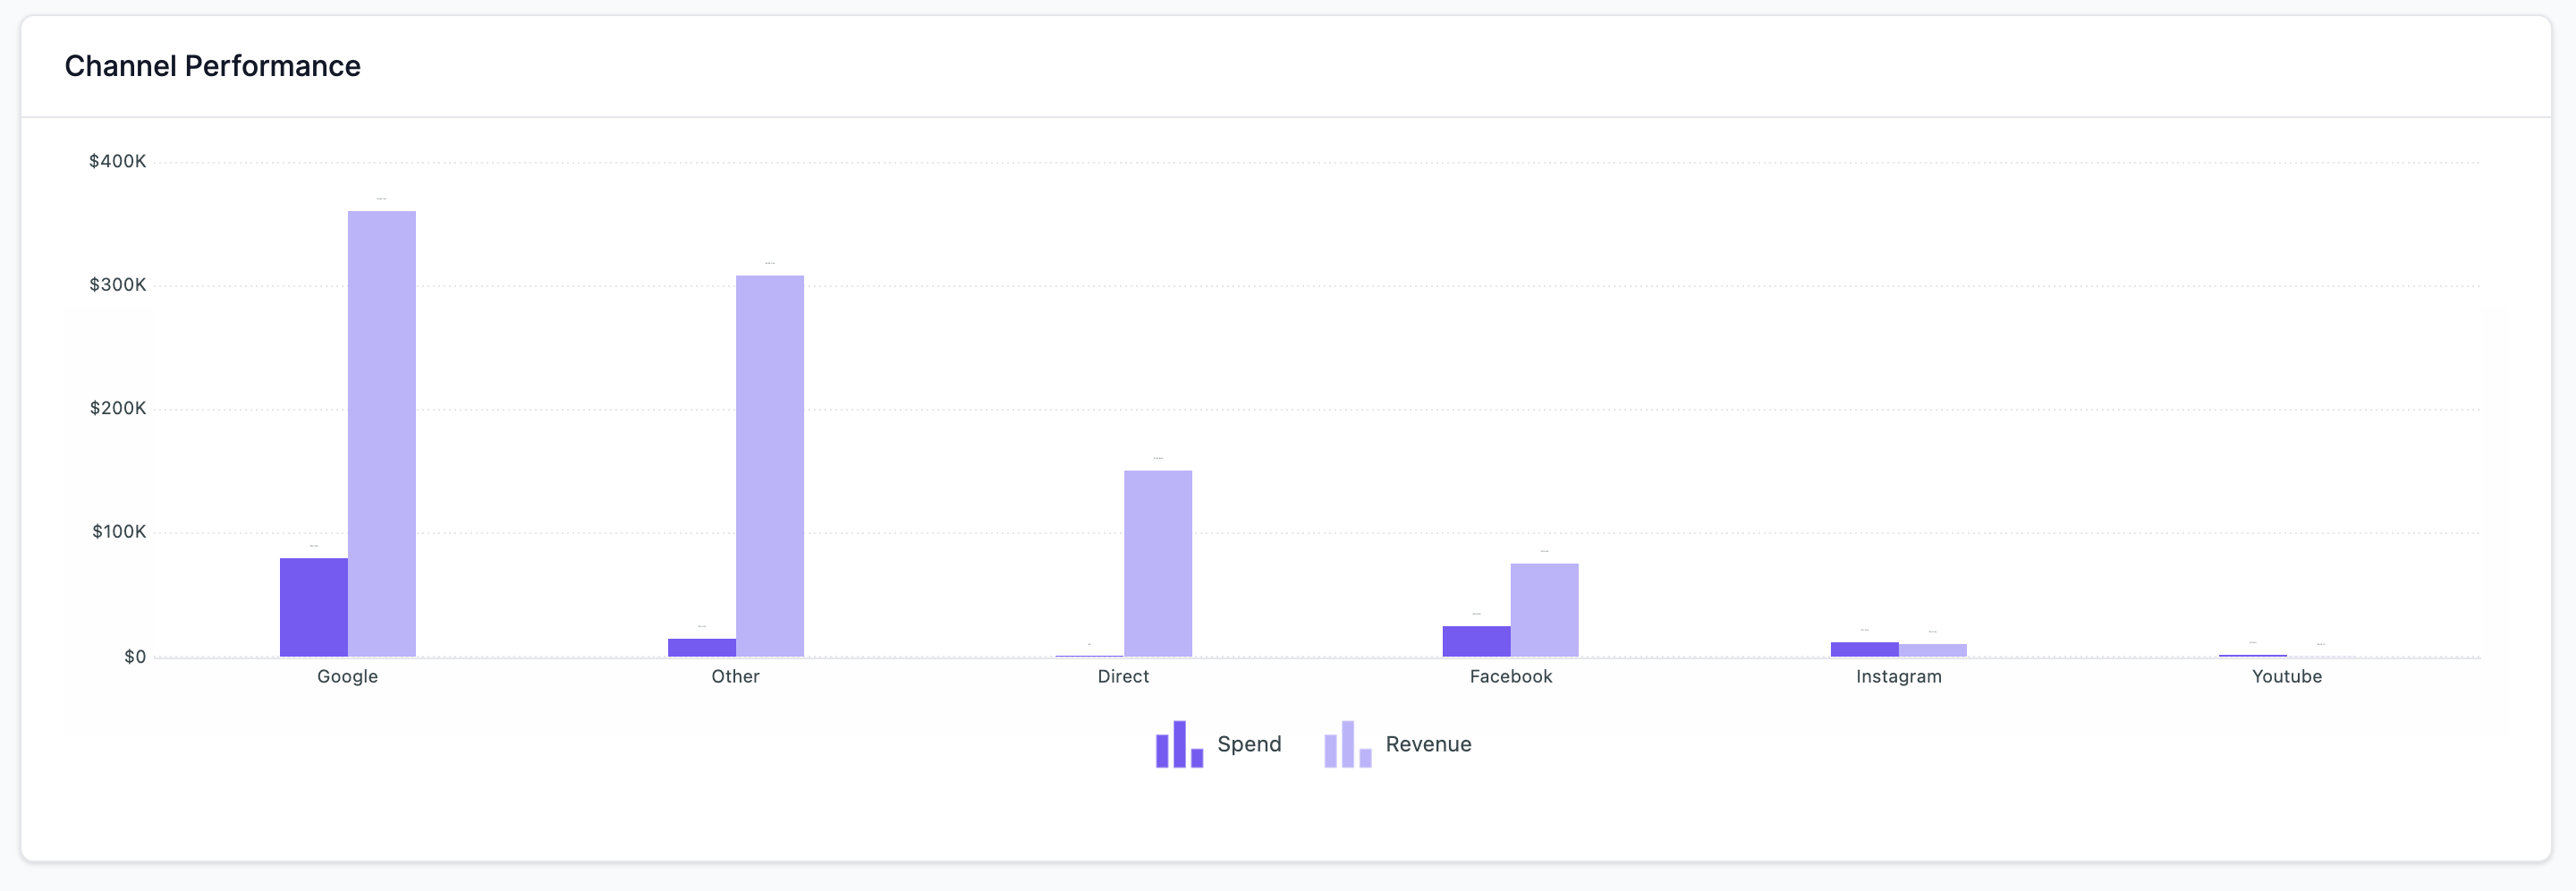
Channel Performance
The Channel performance chart shows your media spend vs revenue for easy analysis.
Updated over 1 year ago