Model Attributes
Understand your Mix Model's performance and input data
The Model tab helps you interpret your model's performance metrics and understand the relationships betweens its input features.
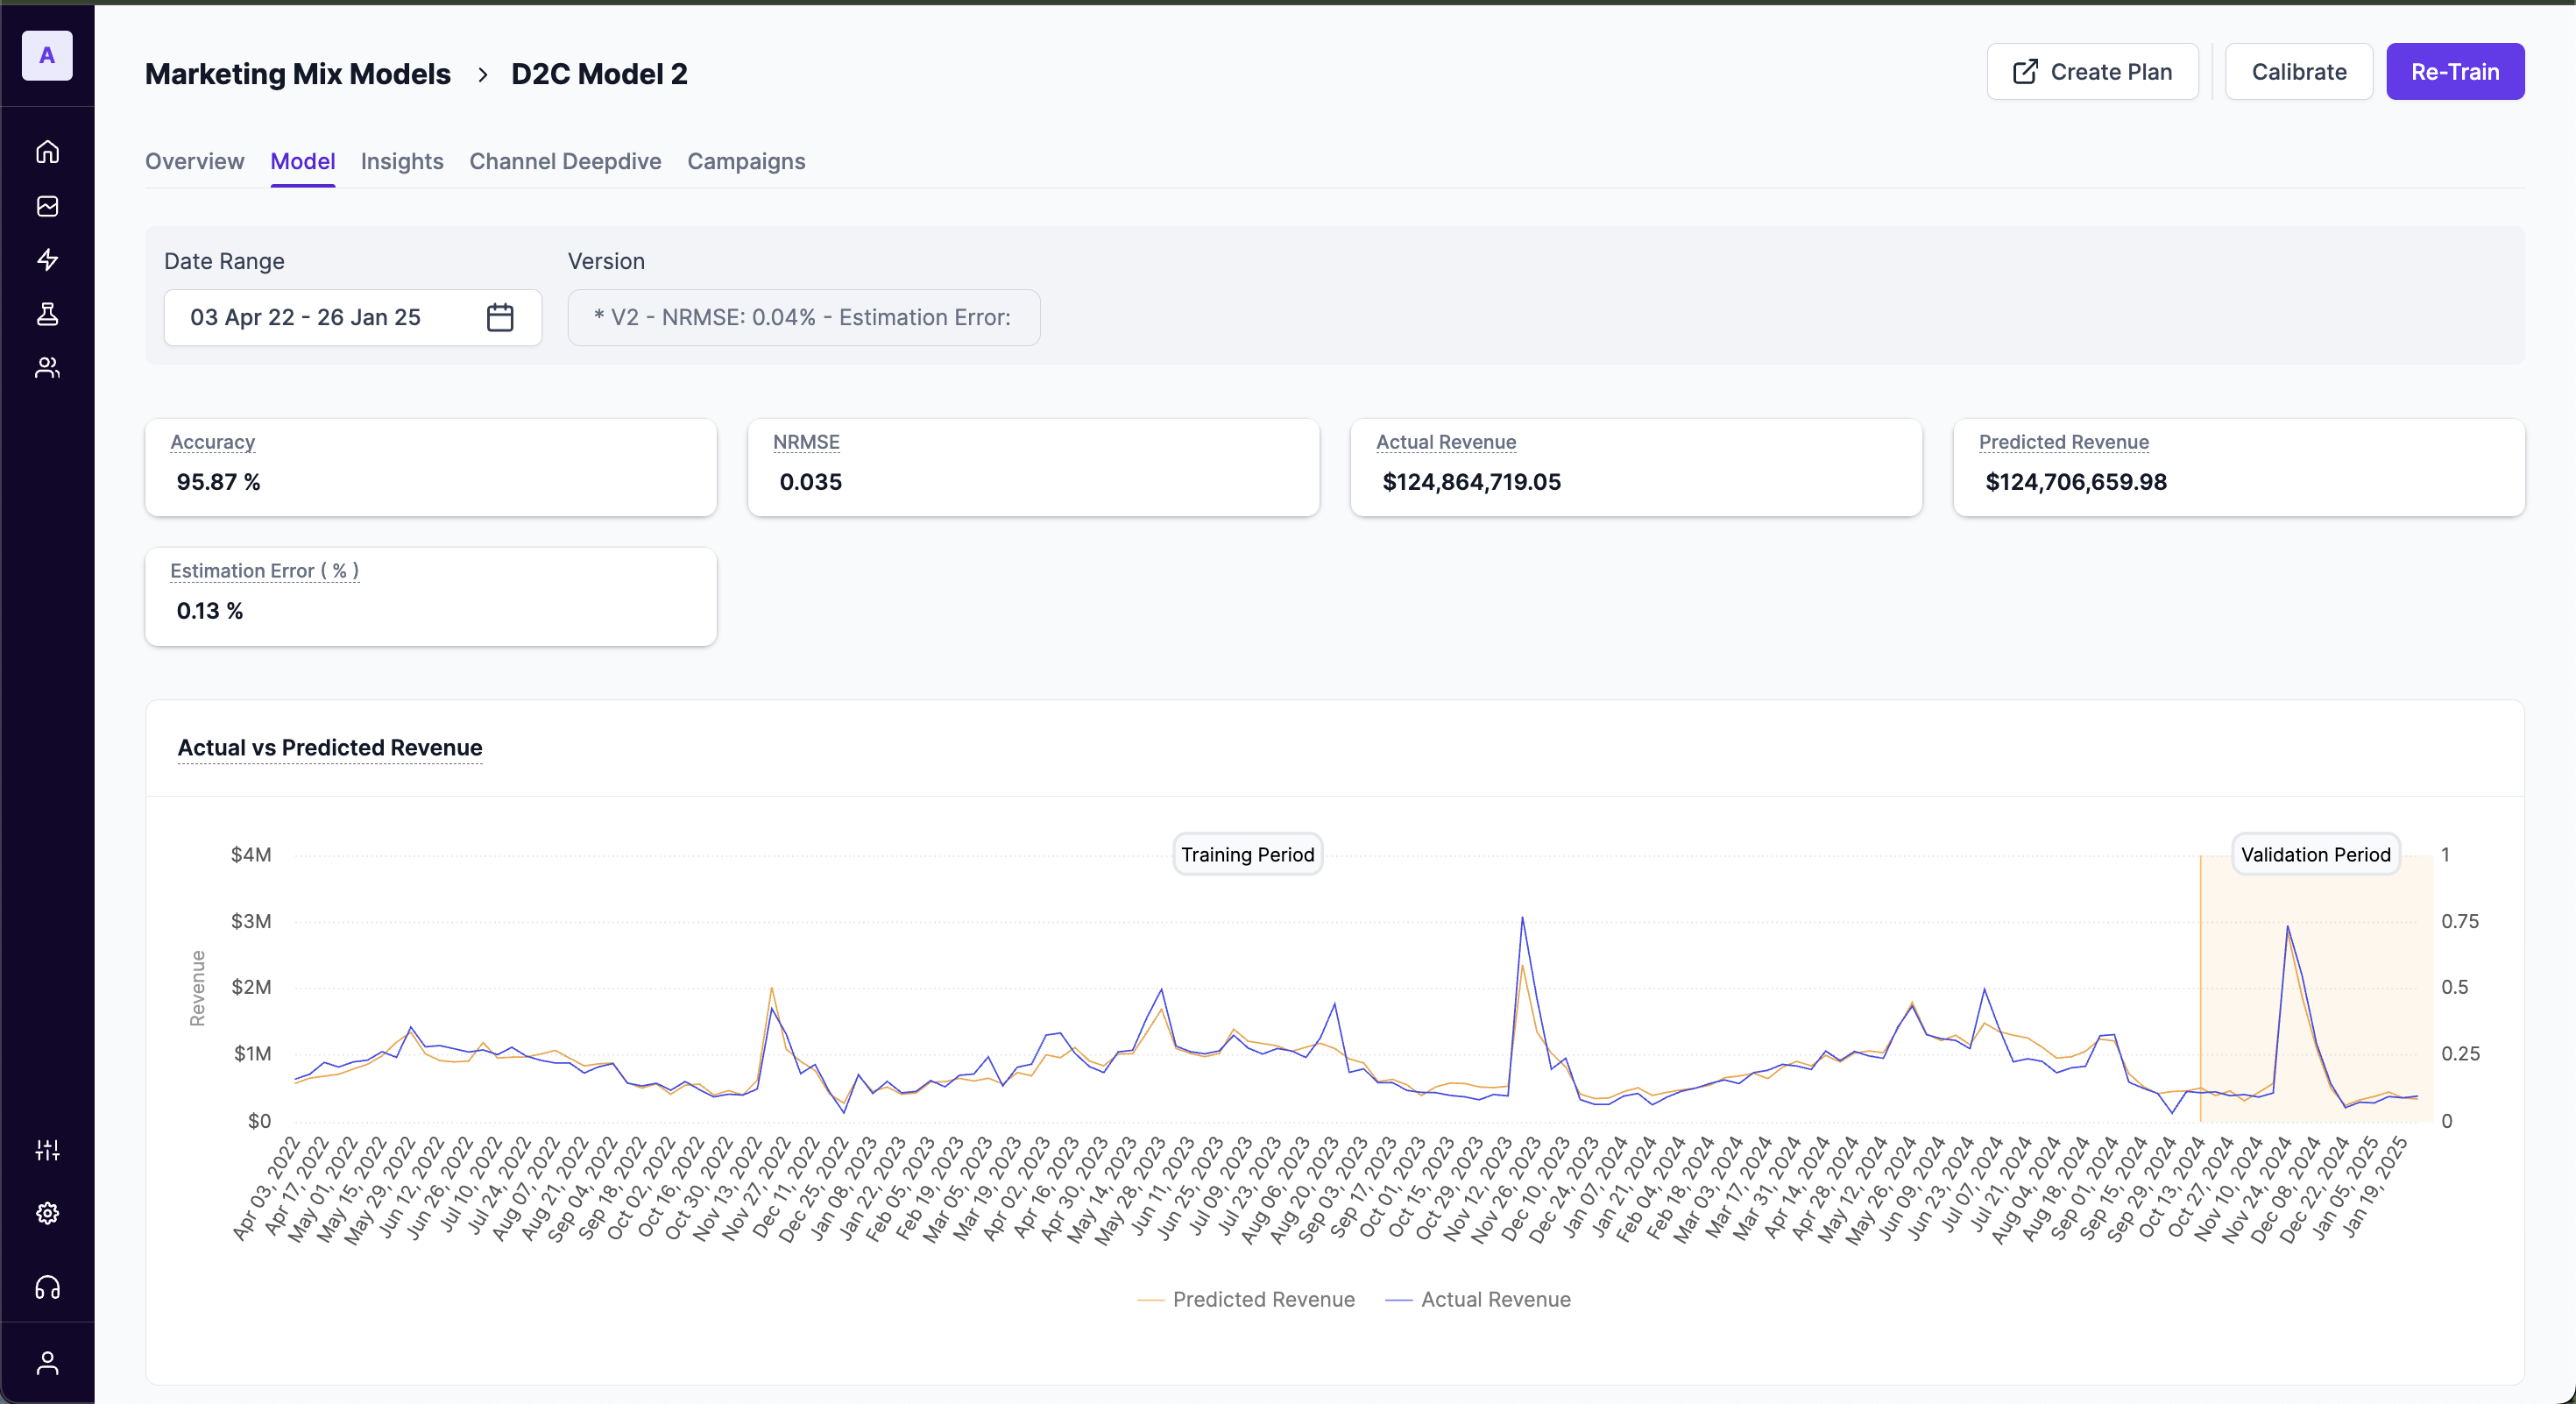
Summary

The summary section offers a quick look into the model's performance. The metrics displayed in this section are
- Accuracy
The model's accuracy is calculated based on how the model's predictions have performed on the last 4 - 12 weeks of unseen data points. This method of accuracy calculation is known as Median Holdout Accuracy. - NRMSE (Normalized Root Mean Squared Error):
The Normalized Root Mean Square Error, also referred to as the prediction error, indicates the accuracy of the model’s predictions. Lower values represent more accurate predictions. It measures the square root of the average squared differences between predicted and actual outcomes. - Actual Revenue:
The real revenue generated during a specific period. - Predicted Revenue:
The revenue estimated by the model based on input data. - Estimation Error (%):
The percentage difference between the actual and predicted revenue, showing how far off the model's predictions are from reality.
Actual vs Predicted Revenue chart
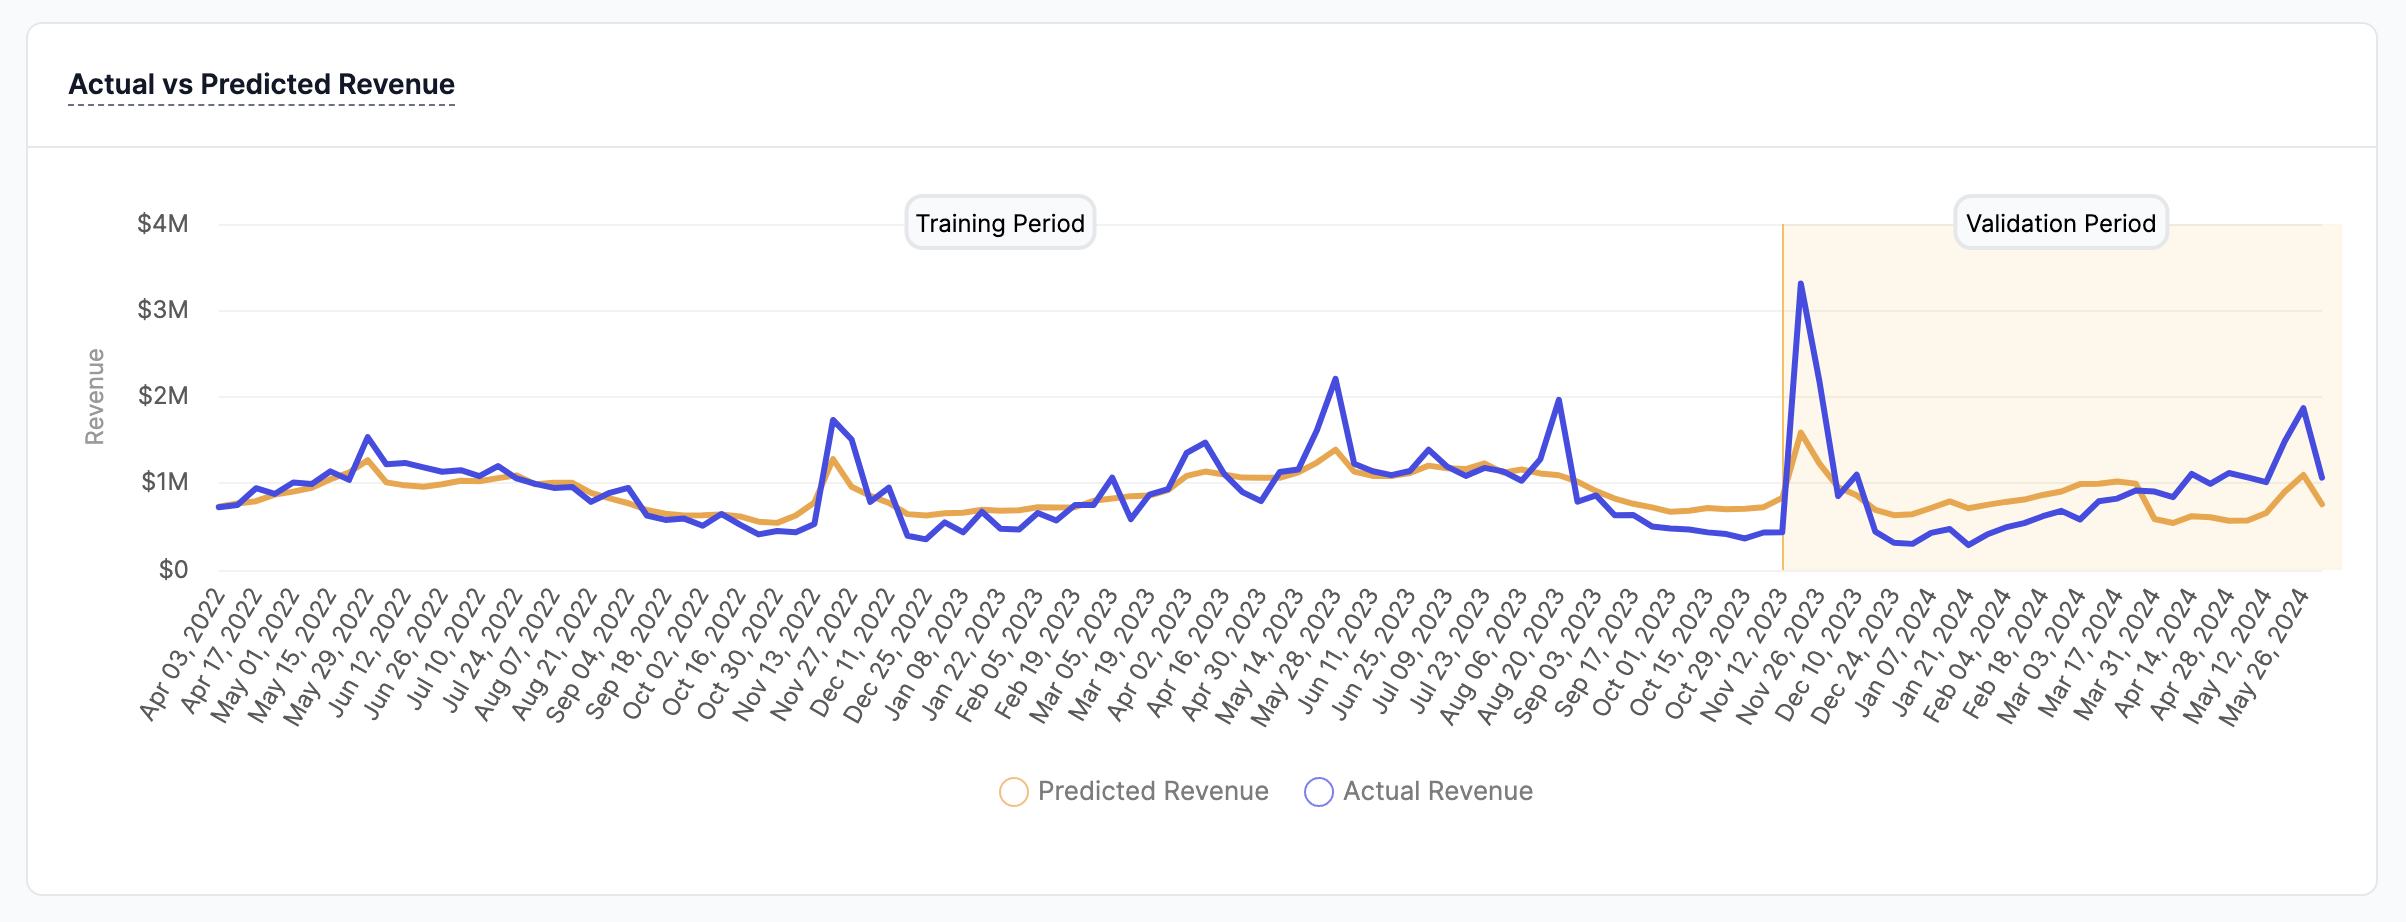
Validation is a critical step in ensuring the accuracy and reliability of your marketing mix model (MMM). This process tests the model's ability to predict outcomes based on unseen data, providing confidence in its forecasts and insights.
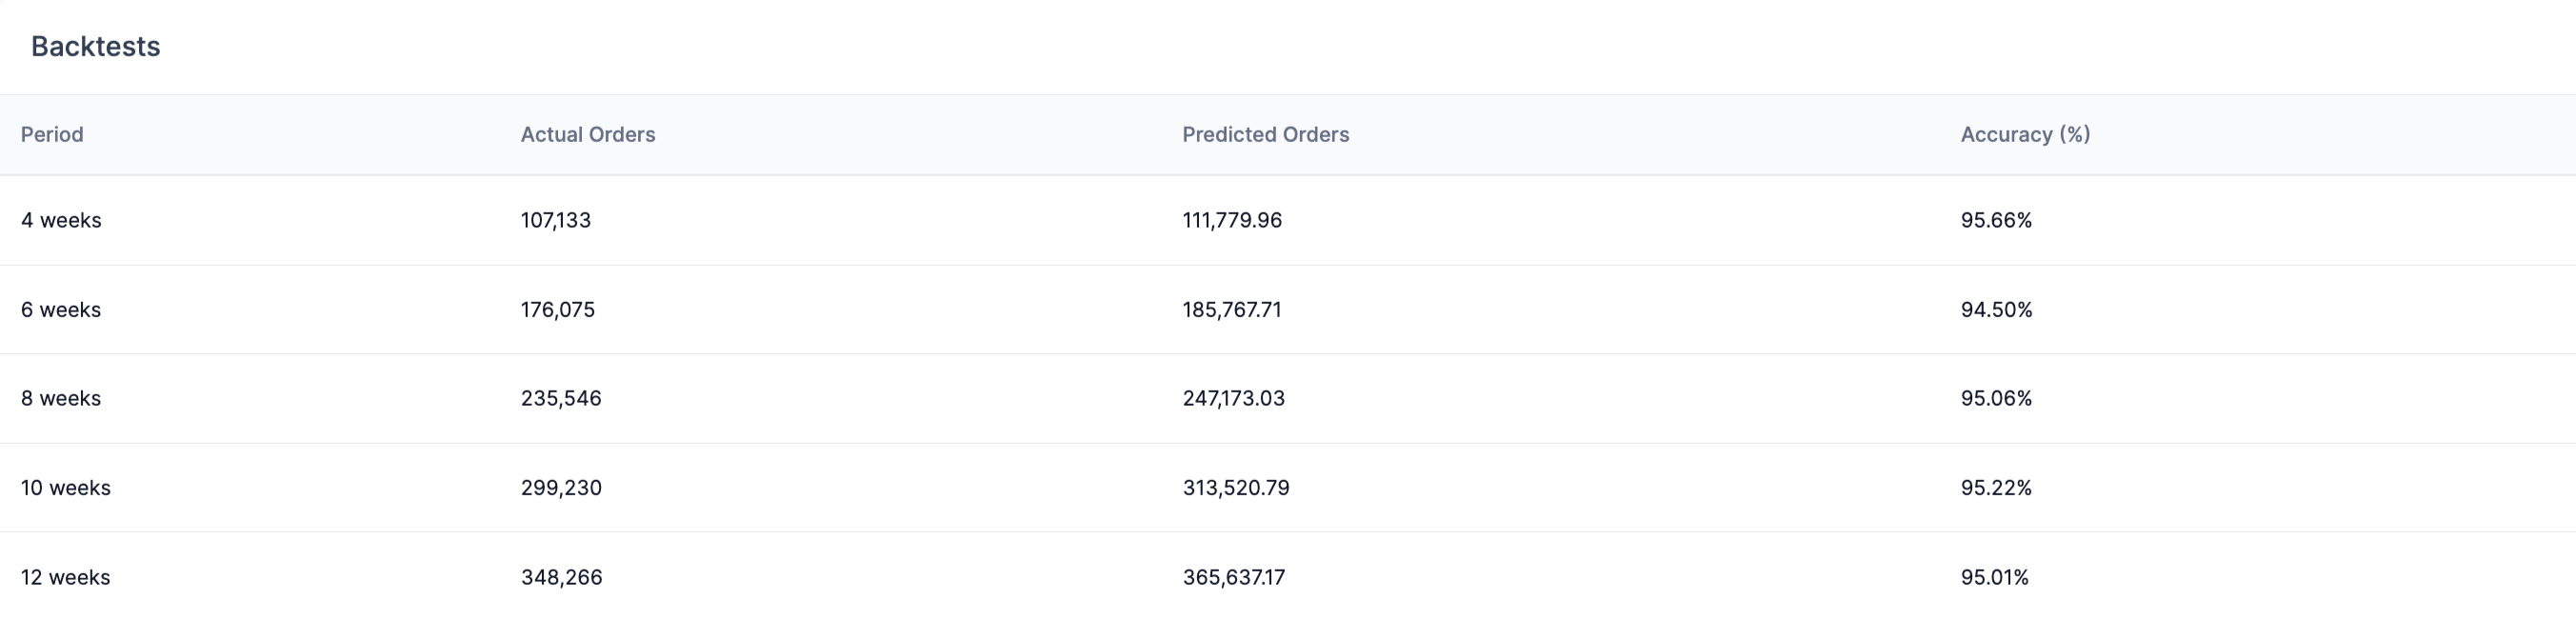
Backtesting
Backtesting is a key component of the validation process. This method involves removing a portion of historical data and training the model up to a certain point in time, such as three months ago. The model is then asked to forecast outcomes for the next three months. While the actual data for these months is known, the model has not seen it, allowing for a comparison between the model’s predictions and the actual outcomes.
Modify the Training size while creating the model to adjust the backtesting period.
Additionally, if the model can consistently make accurate predictions over time, even with changes in marketing budget and other interventions, it provides strong evidence that the model has effectively captured the true causal signals.
Validation Insights
A summary of the insights from all tests conducted over the last quarter is available. The data is presented in intervals of the last 4 weeks, 6 weeks, 8 weeks, 10 weeks, and 12 weeks. These insights include:
- Predicted Revenue or Predicted Conversions: The outcomes forecasted by the model.
- Actual Revenue or Actual Conversions: The real-world results during the validation period.
- Estimation Error (%): The percentage difference between the predicted and actual outcomes.
By examining these insights, you can evaluate the model's accuracy and make necessary adjustments to improve its predictive capabilities.
Saturation and Ad Stock curves
View the conversion distribution for every ad channel using ad stock and saturation hyperparameters. Select the Filter dropdown to view ad stock, saturation and time to conversion for a channel.
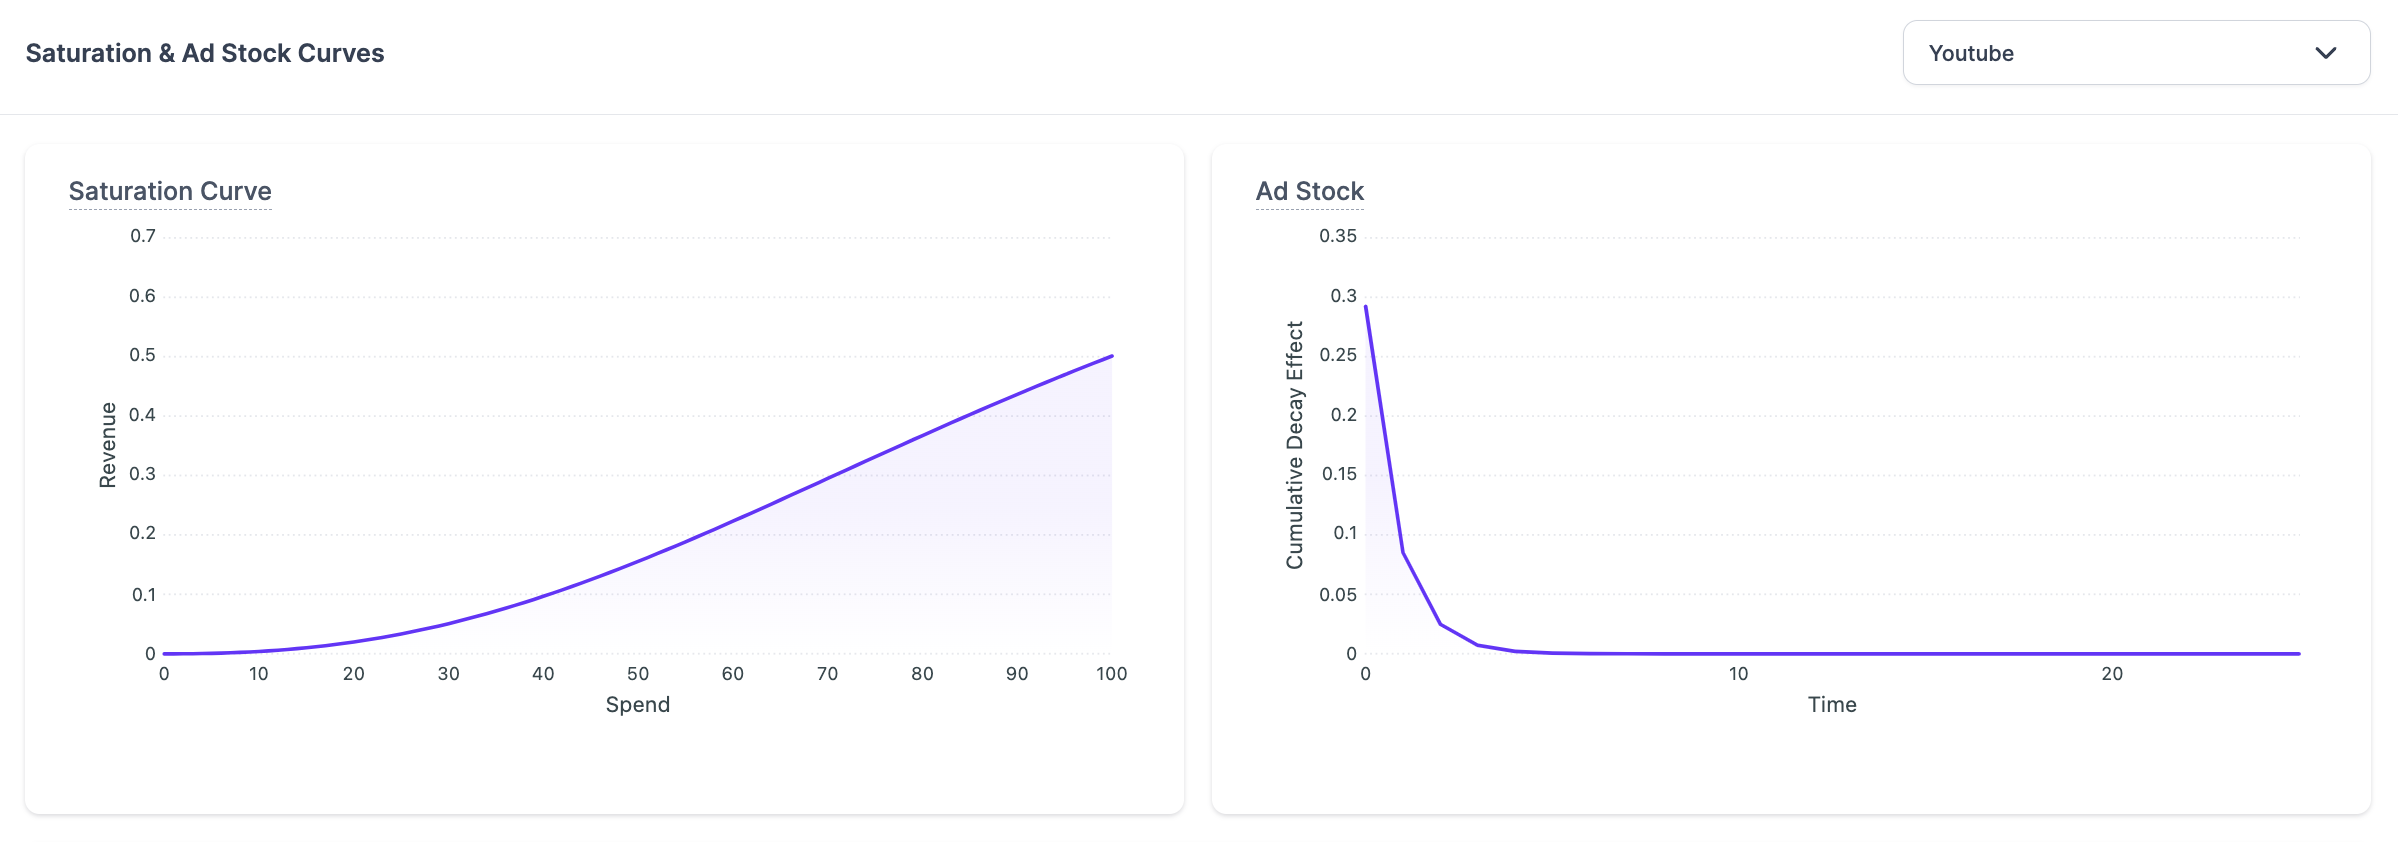
Ad Stock chart
It represents the carryover effect of each media variable (paid & organic). A common hypothesis of adstock is that offline channels have stronger the carryover.
Saturation Curve
The saturation curve shows how the incremental impact of a marketing effort decreases as the level of that effort increases. Saturation points represent the point at which additional investment in a particular marketing activity, such as advertising or promotions, will no longer result in a proportional increase in sales or revenue.
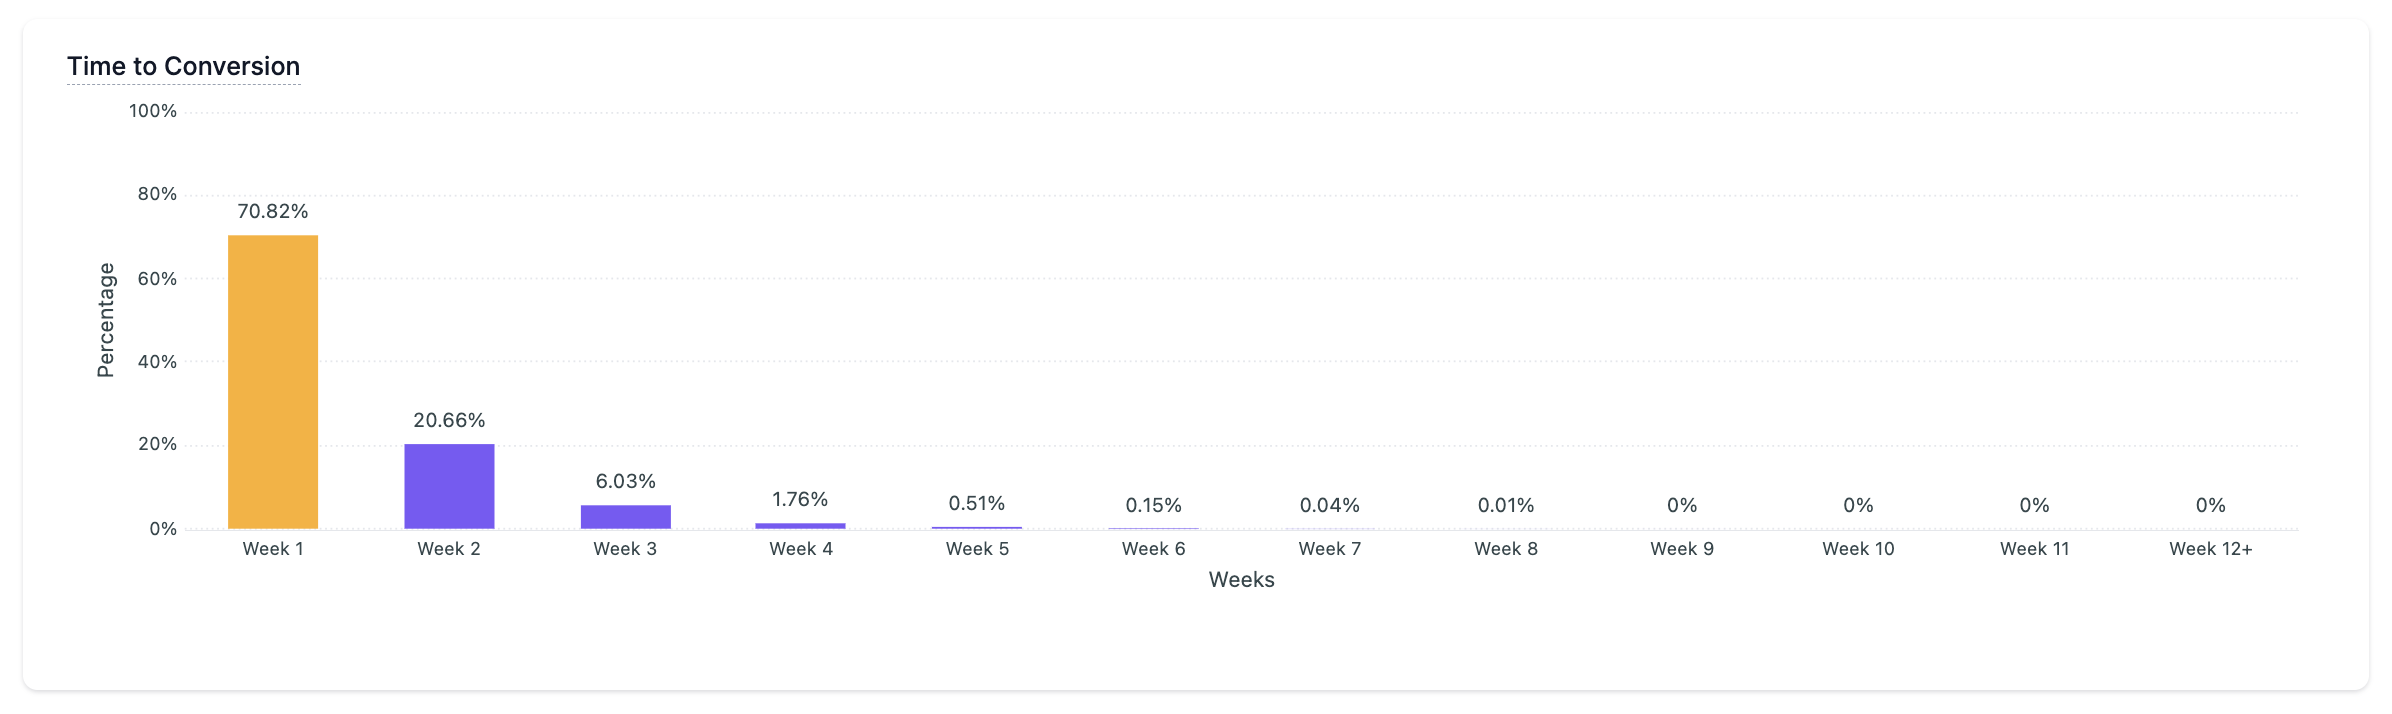
Time to Conversion
View the immediate and carryover conversion effect distributed over time. The chart shows the percentage impact of a channel ad spend on conversions. This helps understand both short-term and long-term impact of ad channels on conversions to help make media optimization decisions.
Immediate VS Carryover effect chart
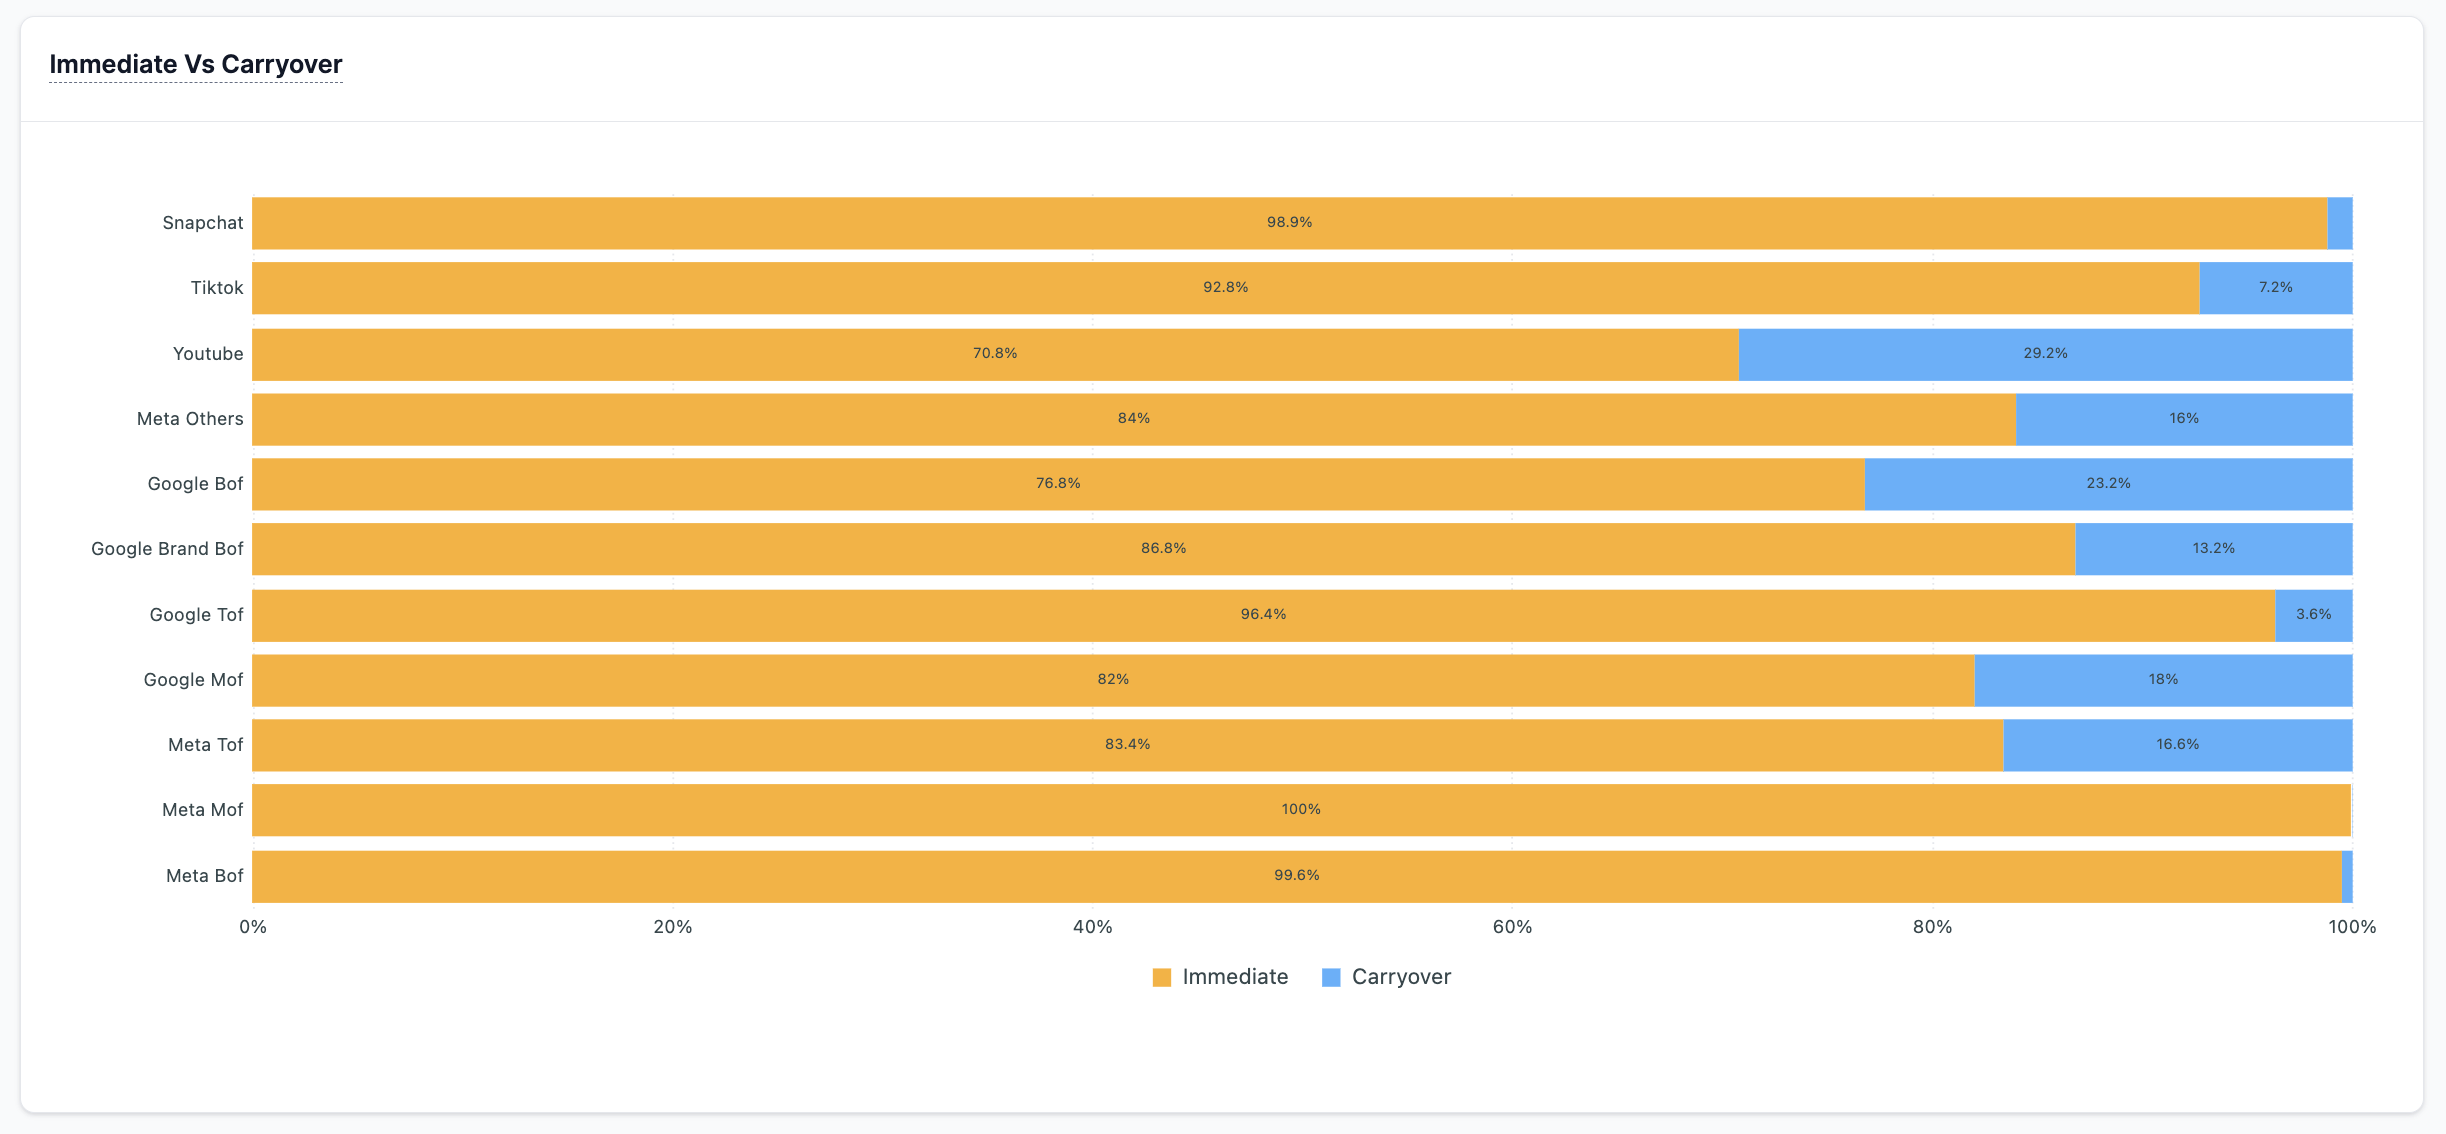
This chart breaks down the impact of media spending on revenue into two distinct categories: Immediate and carryover contributions. It allows you to discern when the majority of a campaign's effects are realized.
- Immediate Contribution: This refers to the percentage of direct effect of media spending within the same period it is spent. For instance, if an advertisement runs in week 1 of June, the immediate contribution is the revenue directly generated from this advertisement in week one of June itself.
- Carryover Contribution: This involves the percentage residual effects of past media spending that continue to influence revenue beyond the initial period of the spend. This phenomenon is also known as adstock. Conceptually, carryover effects are similar to brand equity metrics such as ad recall or campaign.
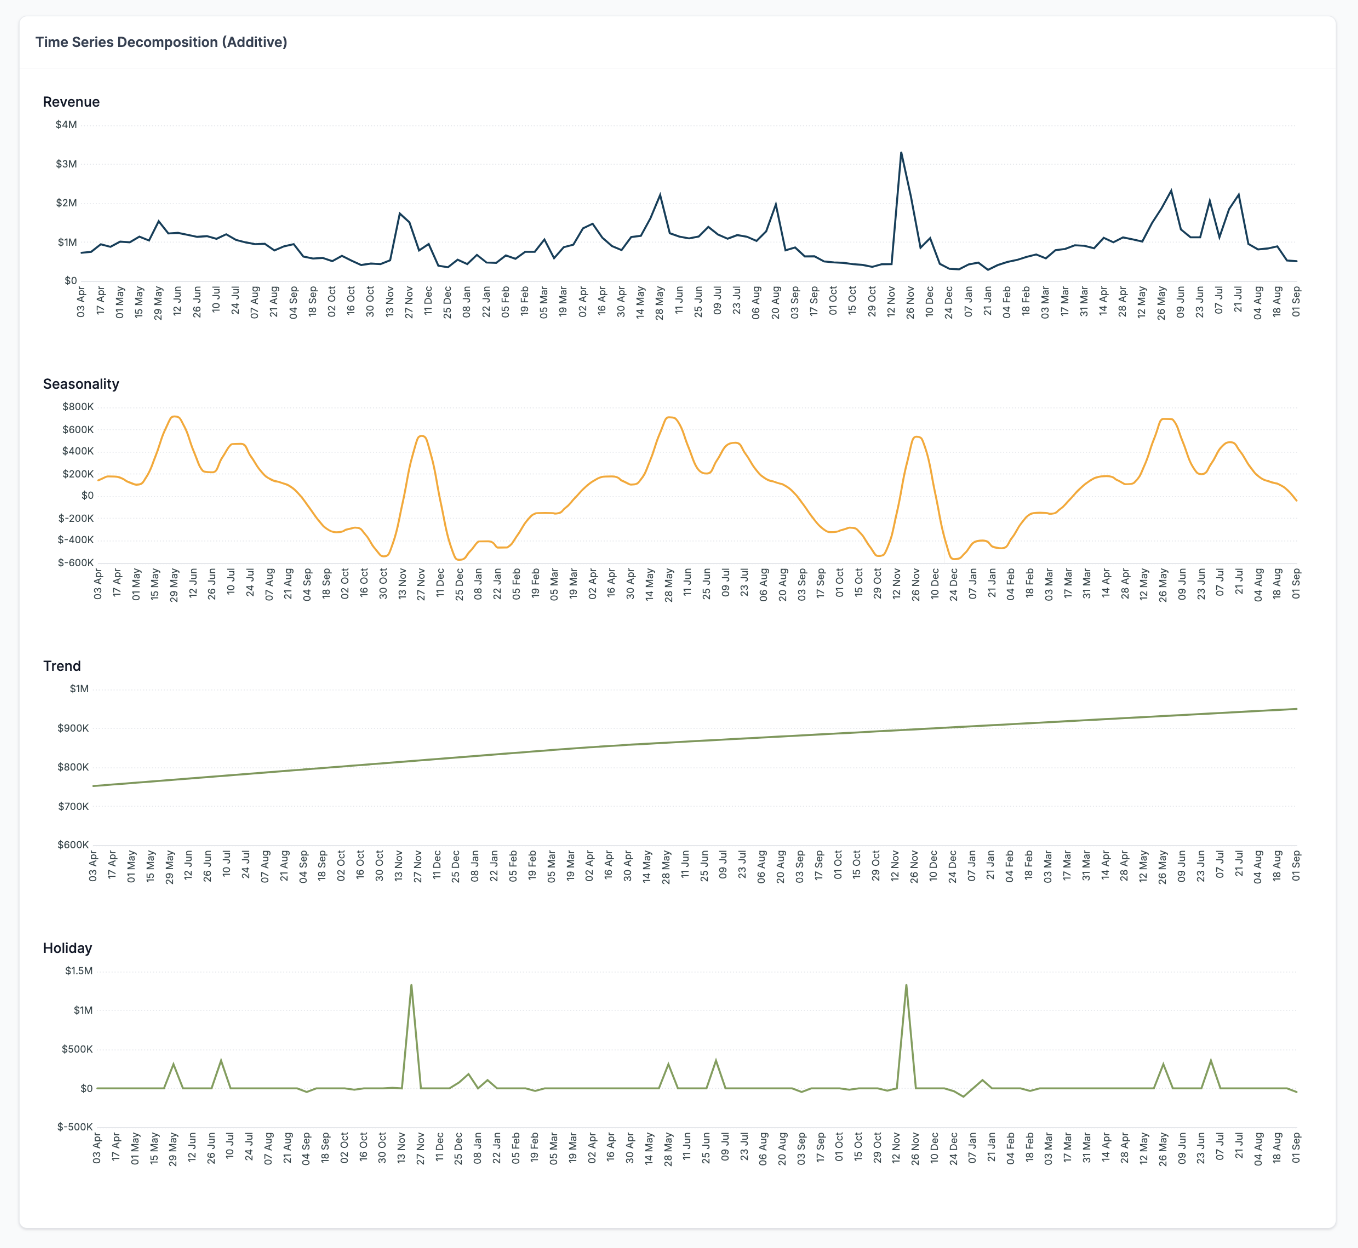
Time Series Decomposition (Additive)
Time series data includes components like seasonality, trends, and holidays that impact conversions. This breakdown helps marketers understand how these factors influence MMM results before modeling. You can view these components and choose whether to include them in future models. Additionally, it aids in setting the base period when using the Planner for forecasting.
Updated 12 months ago