Geo Experiment Design
Design and Deploy your Geo Experiment
Design and deploy geo experiments to accurately measure the incremental impact of your marketing efforts across various ad platforms. This guide walks you through the step-by-step process of designing a new geo experiment.
Interactive Demo: Designing a Geo Experiment
Initiating a New Experiment
To begin designing your geo experiment, navigate to the Experiments section from the main Lifesight UMM dashboard and click on + Create Experiment. You will then be guided through a series of steps: Design, Data, Markets, Campaigns, and Review.
Step 1: Hypothesis Creation
The first step in designing your experiment is to define your hypothesis and the type of experiment you wish to run.
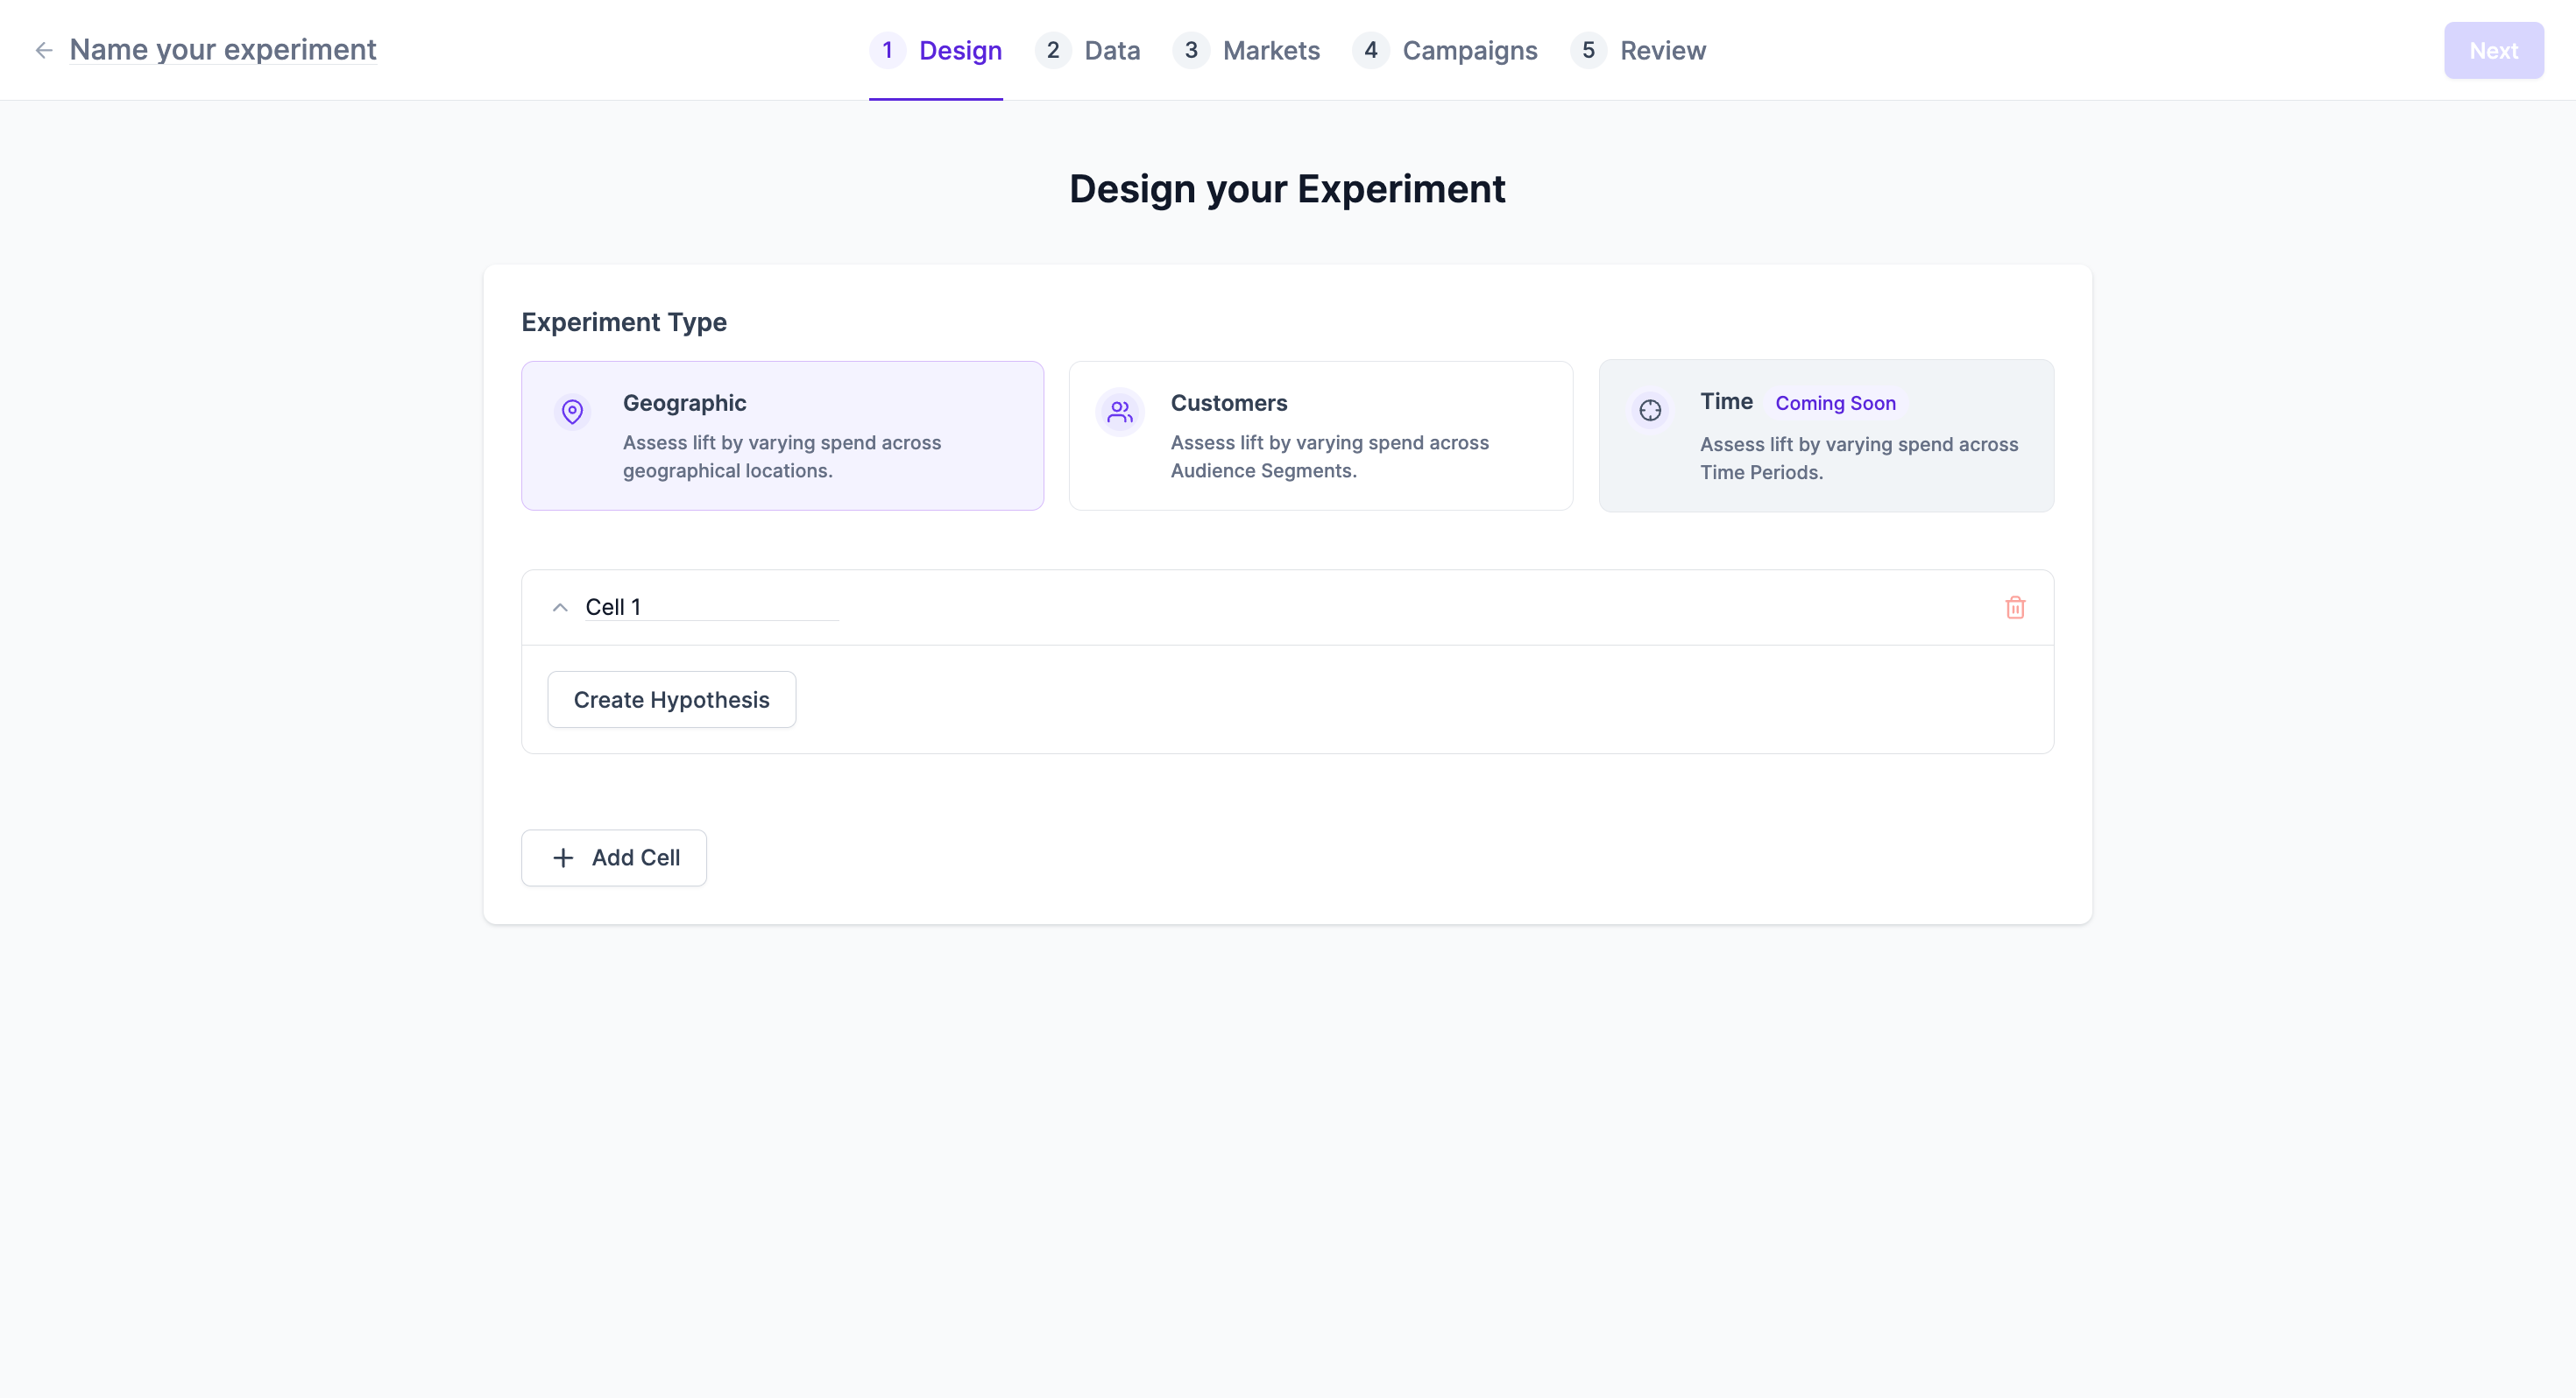
Experiment Type
Lifesight supports various experiment types. For geo experiments, you will typically select:
- Geographic: Assess lift by varying spend across geographical locations.
Defining Your Hypothesis
Within "Cell 1" (and subsequent cells if you are running a multi-cell experiment), you will create your hypothesis.
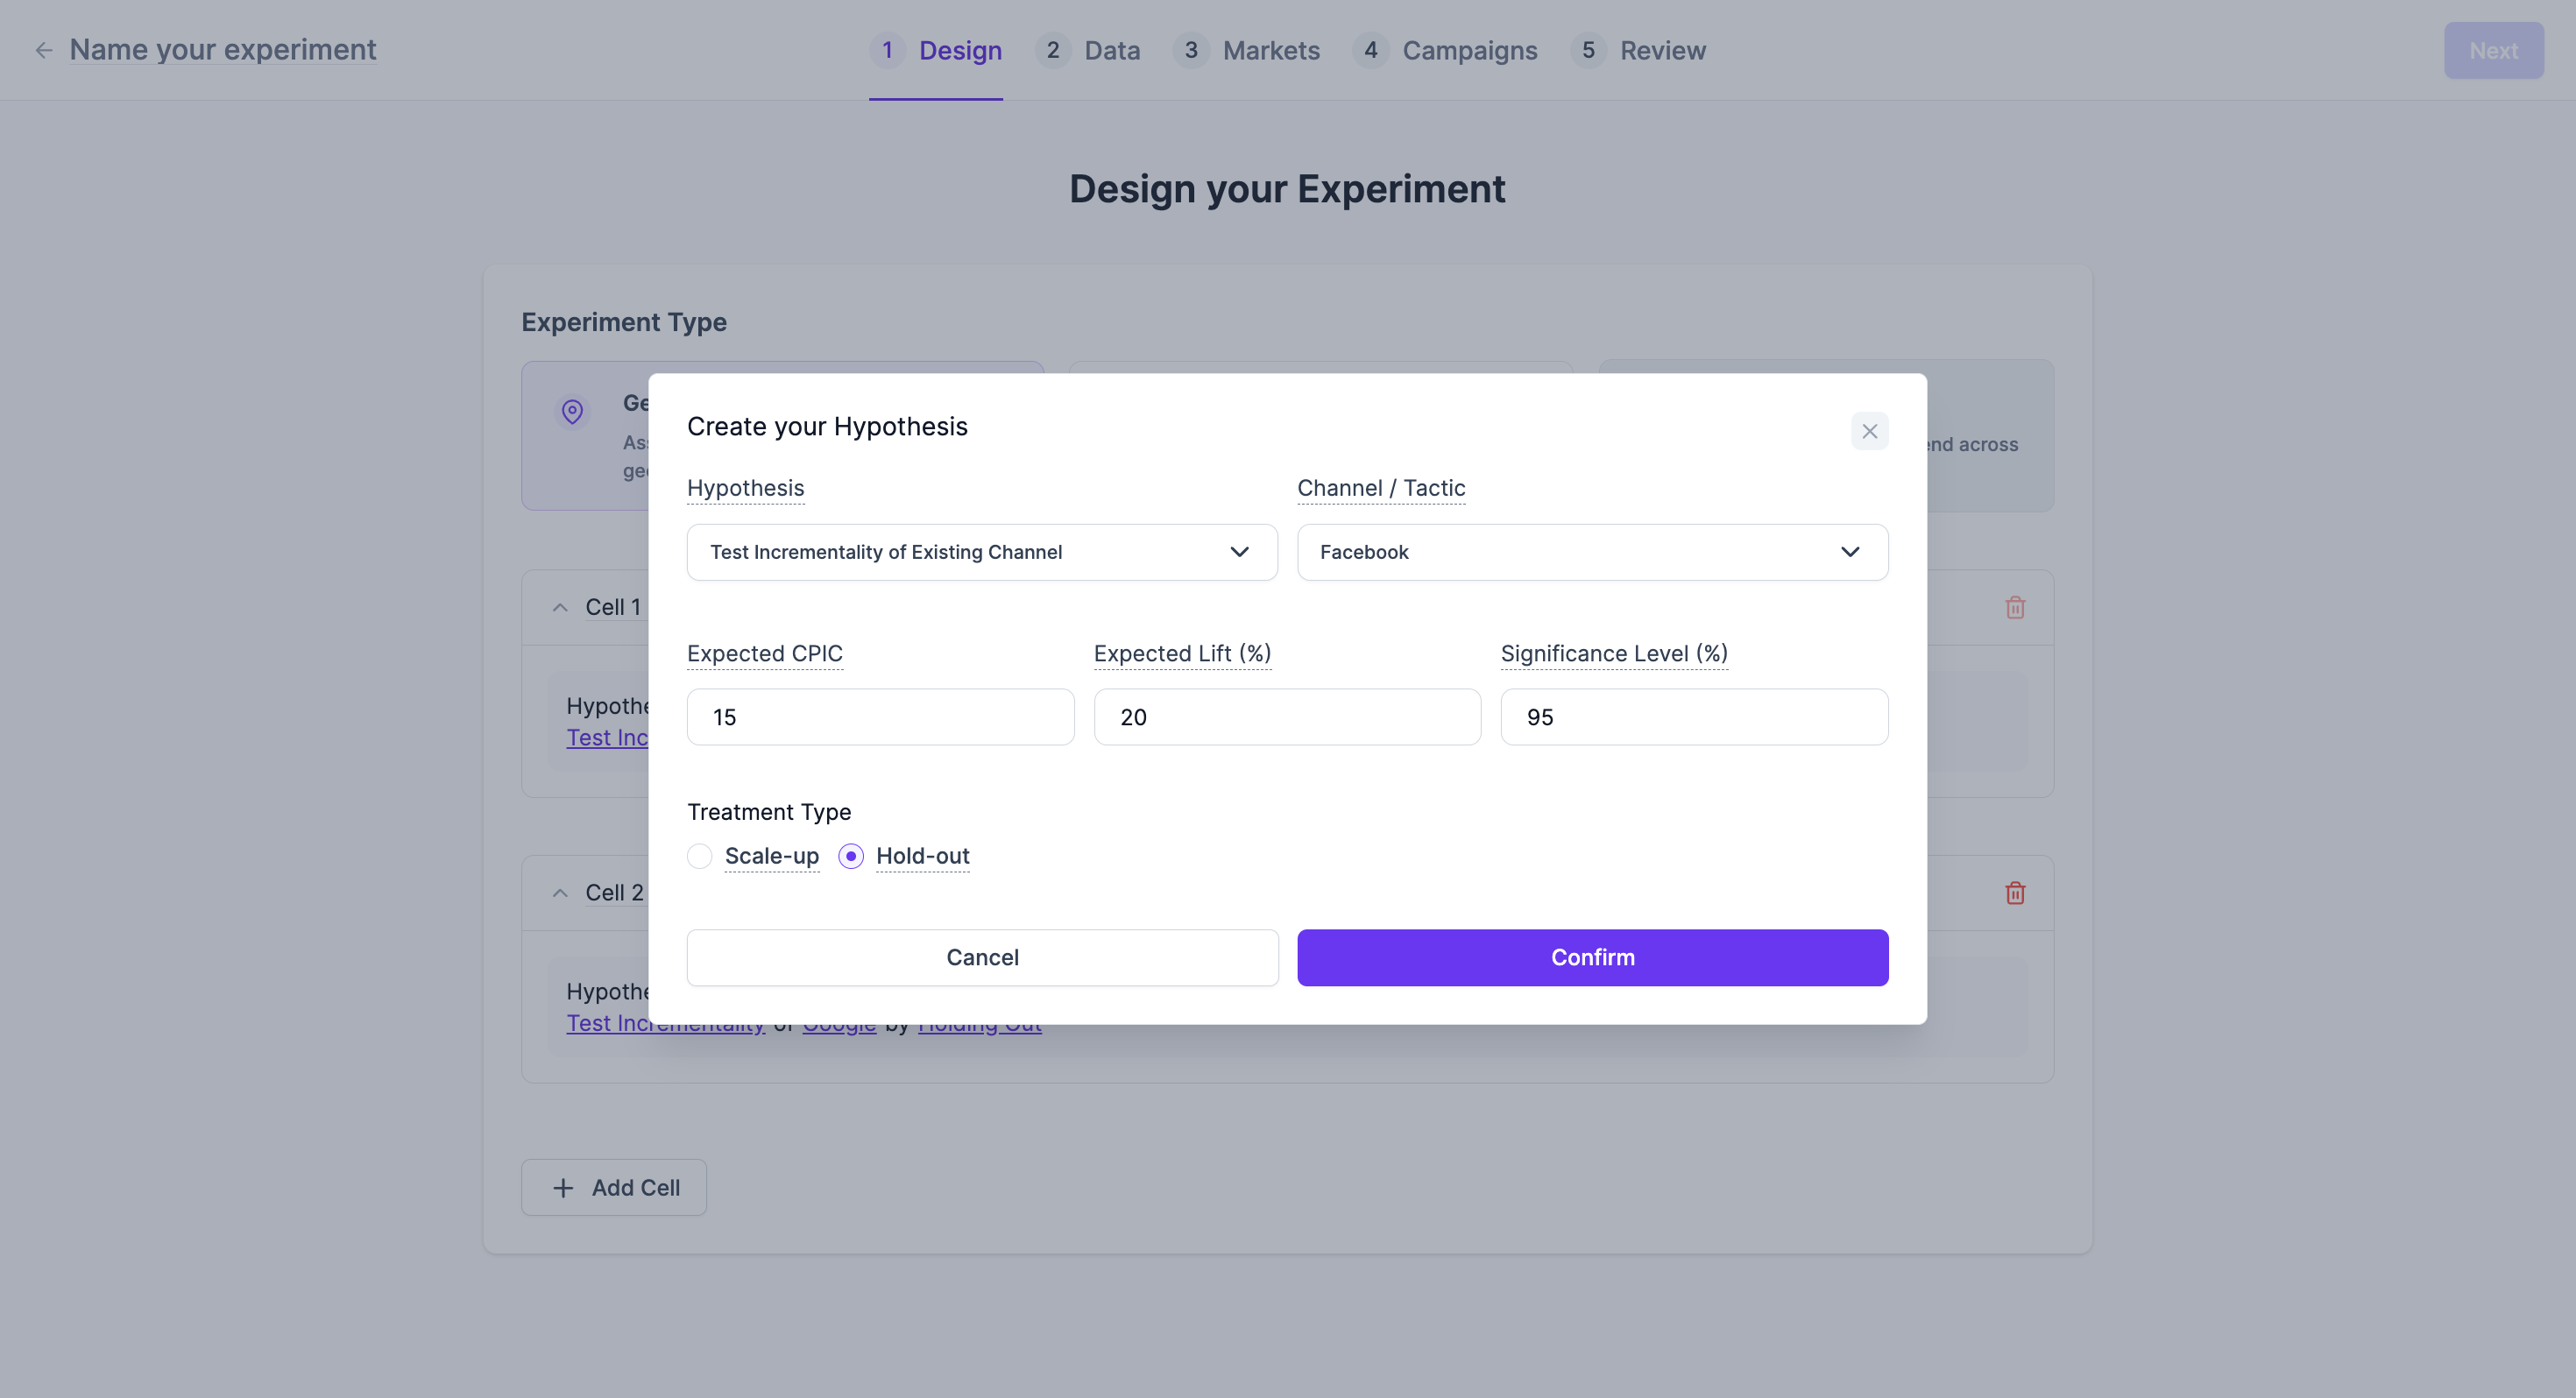
To create your hypothesis:
- Click on Create Hypothesis in the "Cell 1" section.
- Hypothesis: Select the type of incrementality test you want to perform (e.g., "Test Incrementality of Existing Channel").
- Channel / Tactic: Choose the specific channel or tactic you are testing (e.g., Facebook, Google).
- Expected CPIC (Expected Cost Per Incremental Customer): Enter your expected value for the chosen metric.
- Expected Lift (%): Input the anticipated percentage lift you expect from the experiment.
- Significance Level (%): Define the desired statistical significance level for your experiment results.
- Treatment Type: Select either Scale-up or Hold-out.
- Click Confirm to save your hypothesis.
You can add multiple cells to test different hypotheses simultaneously by clicking + Add Cell.
Step 2: Data Selection and Validation
After defining your hypothesis, you need to select and validate the data that will be used for your experiment. This data helps in analyzing your treatment and control groups.
Experiment Duration & Historical Timeframe
- Experiment Duration: Select the planned duration for your experiment.
- Historical Timeframe: Choose the historical period for data analysis
Data Upload
Lifesight provides flexibility in how you bring your data into the platform:
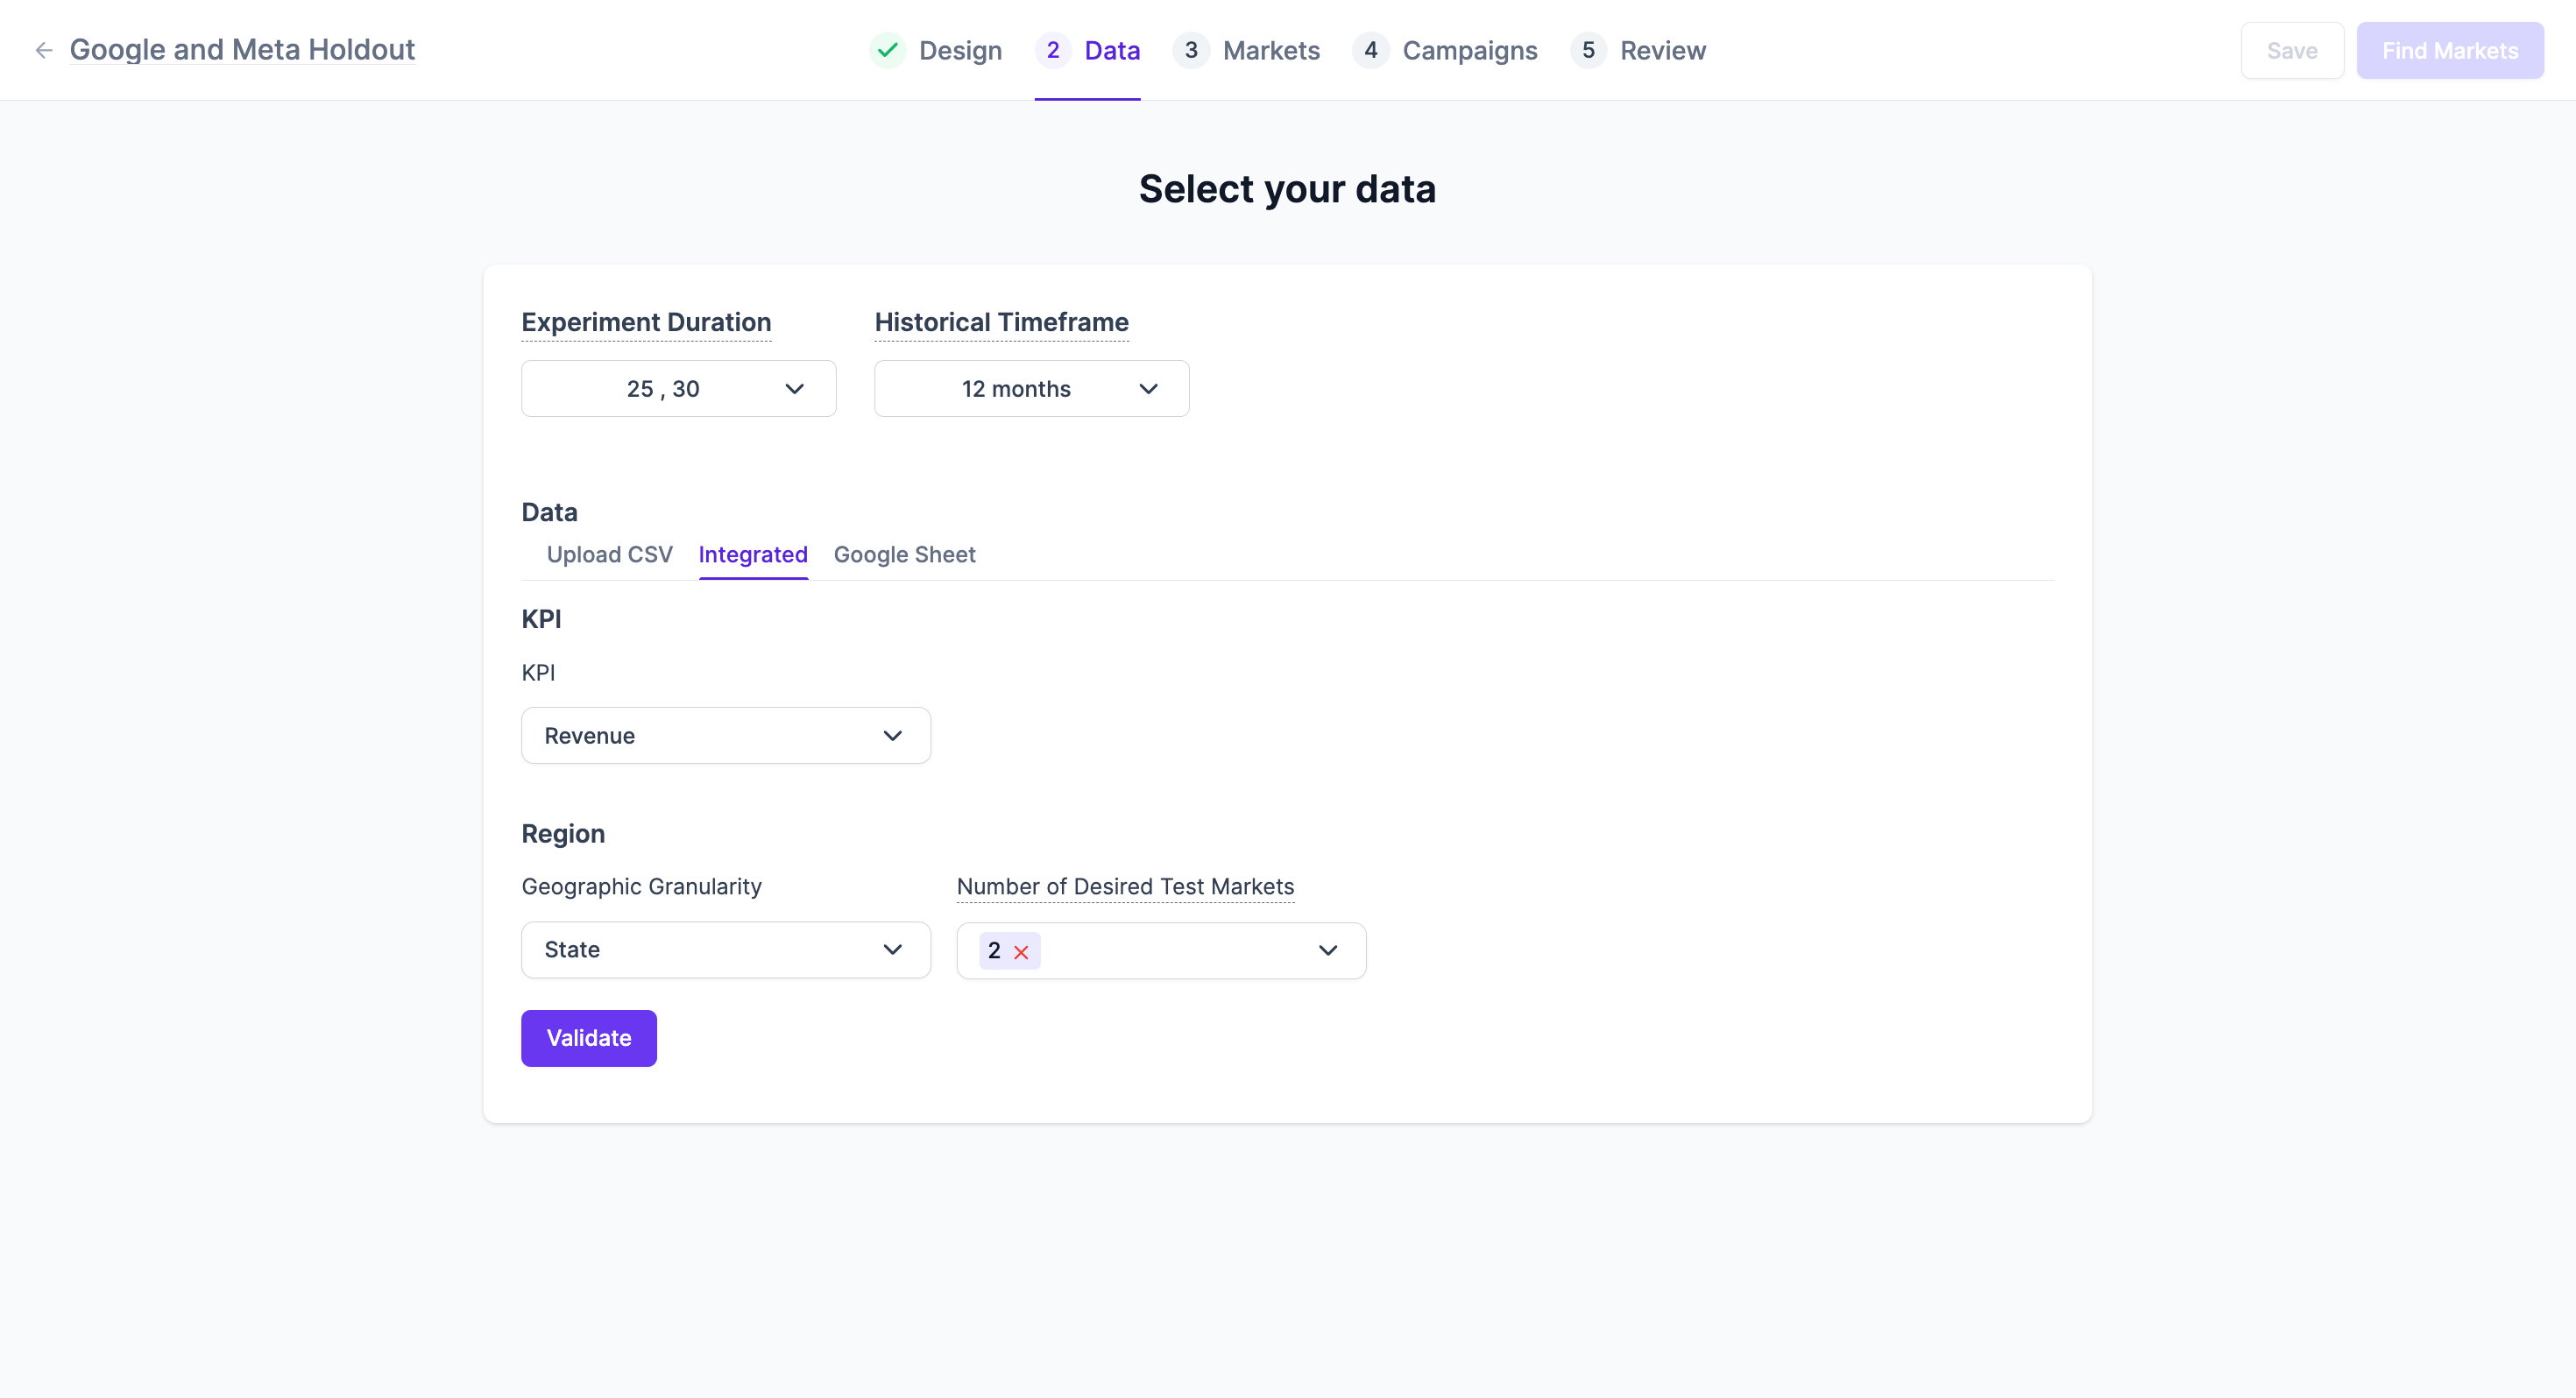
- Upload CSV: You can upload a CSV file containing your historical data. Historical data for experiment design typically needs to contain 3 fields: Date, Geography (State, City, or Zip Code), and output KPI (Eg: Revenue, Orders, Installs, etc.,)
- Integrated: Connect directly to integrated data sources.
- Google Sheet: Link a Google Sheet for data ingestion.
KPI Selection
Select the Key Performance Indicator (KPI) that your experiment will measure (e.g., Revenue).
Region and Geographic Granularity
- Geographic Granularity: Define the level of geographic detail for your experiment (e.g., State).
- Number of Desired Test Markets: Specify how many test markets you wish to include.
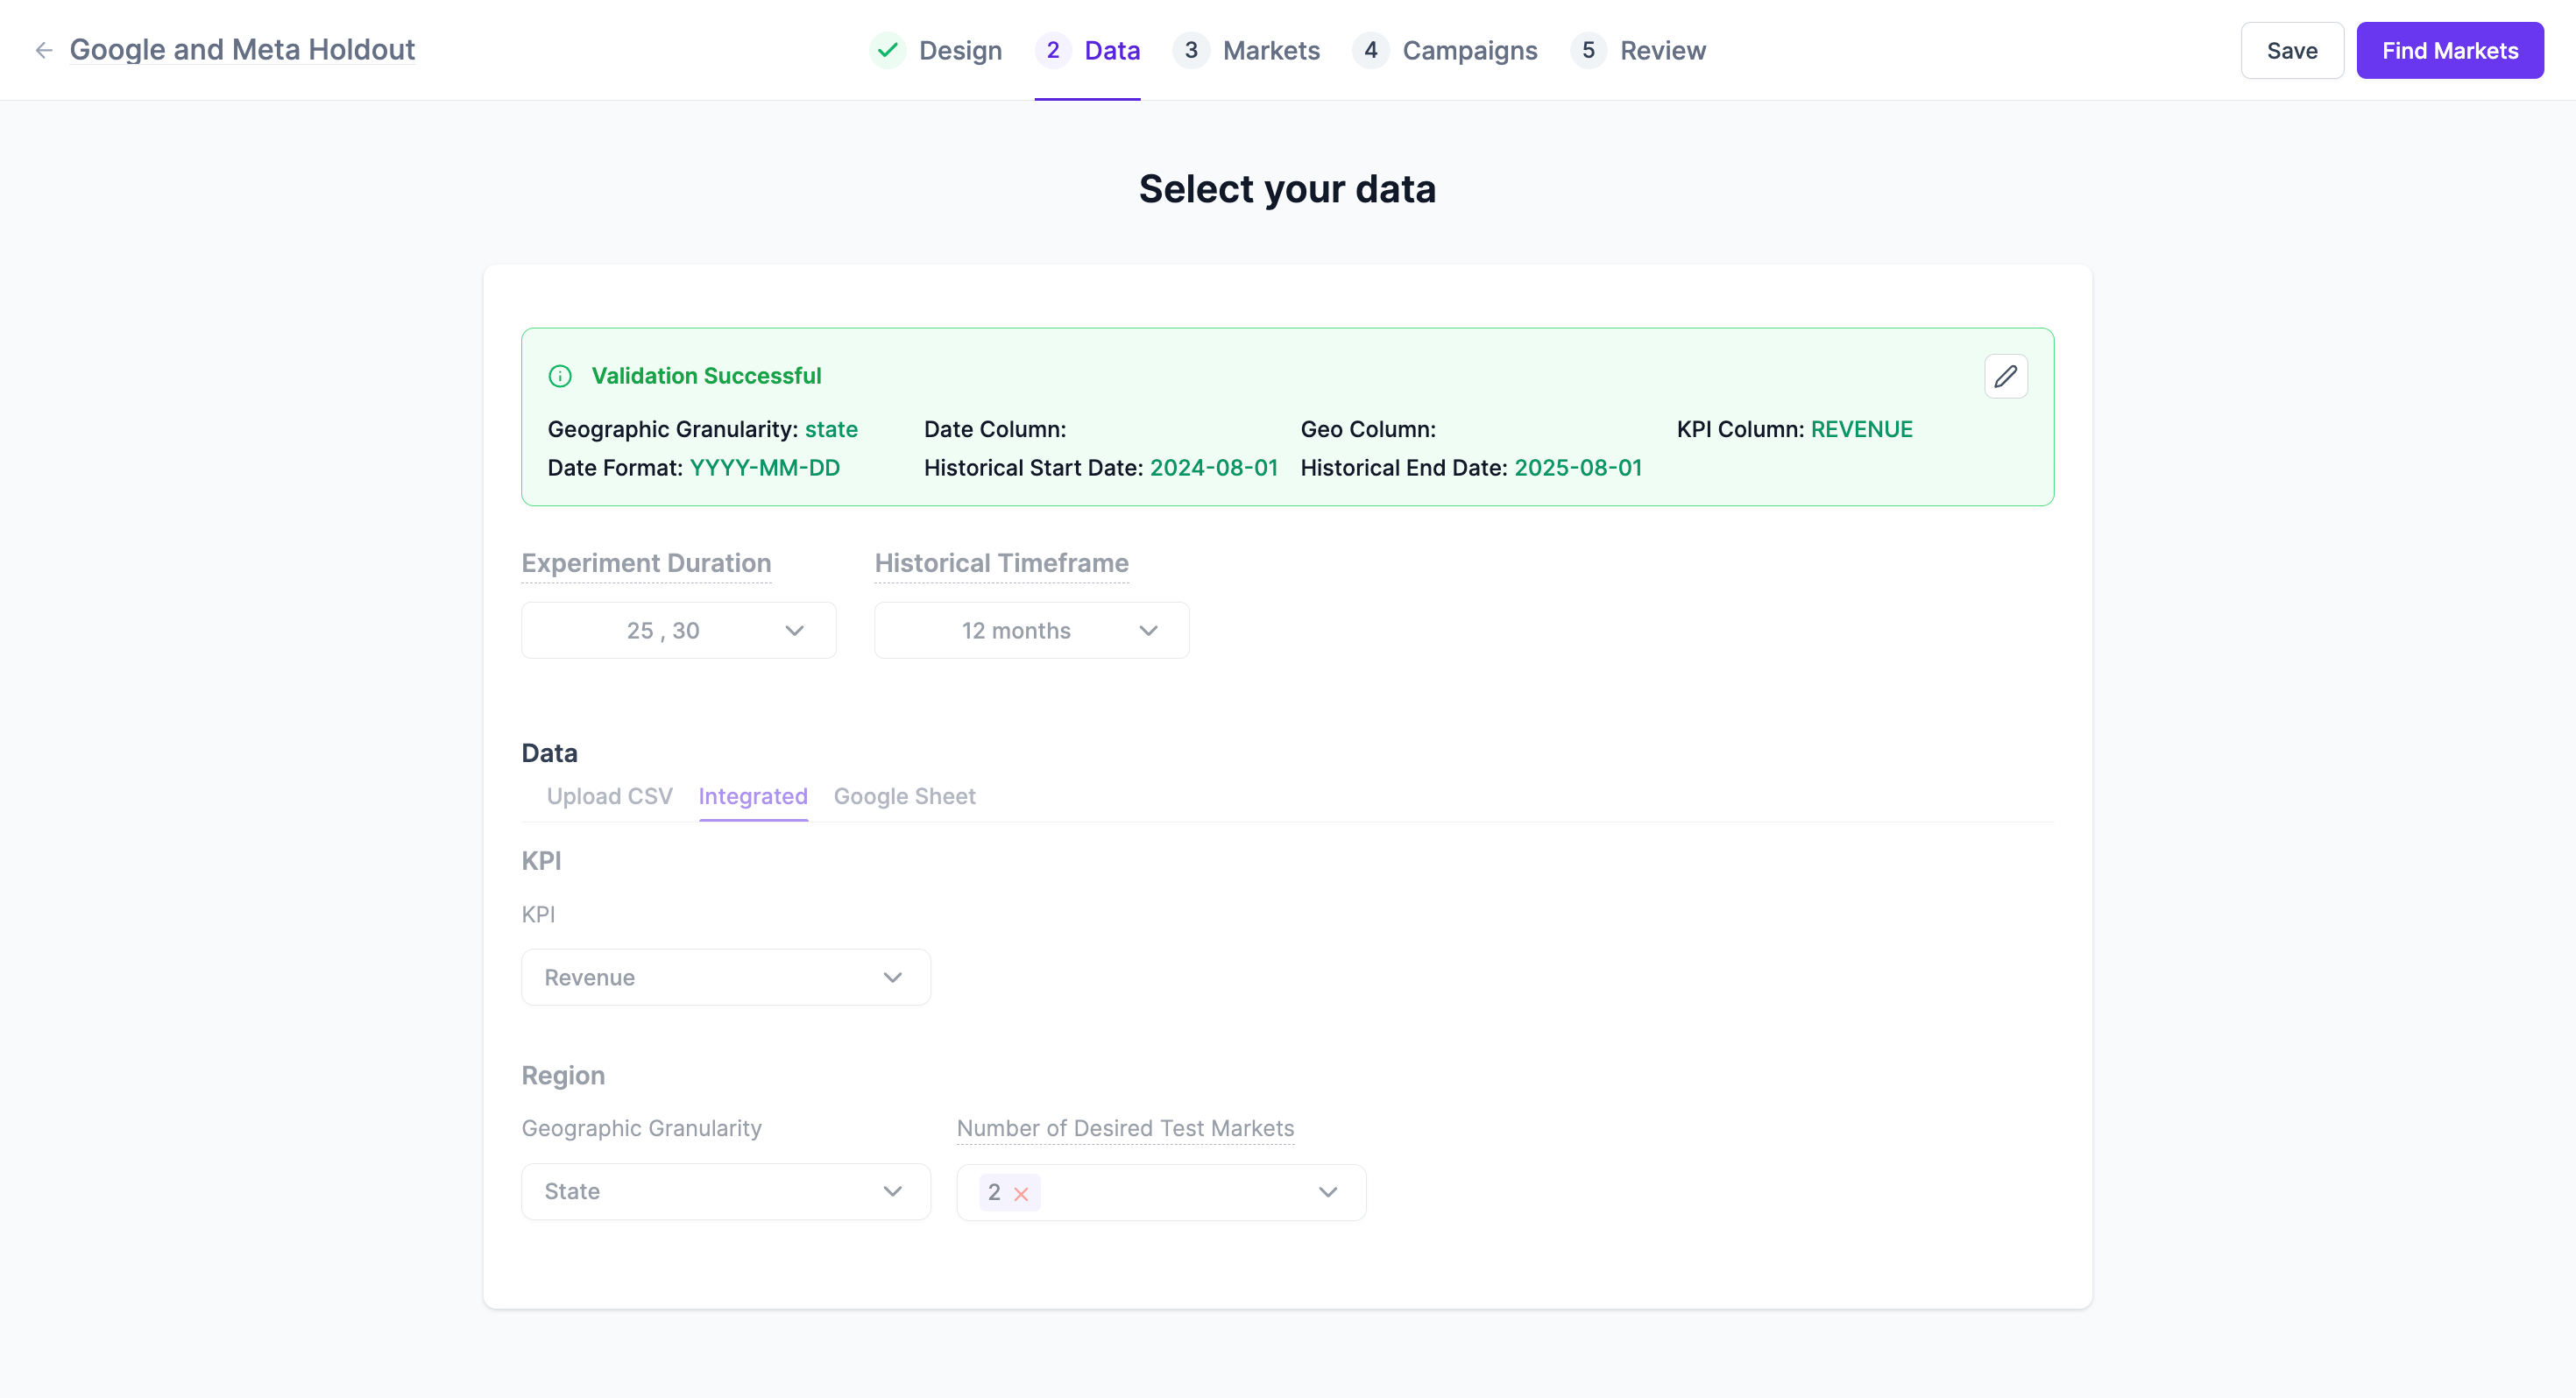
Data Validation
After selecting your data parameters, click Validate. The system will process your data and confirm its suitability for the experiment. A "Validation Successful" message will appear, confirming details like Geographic Granularity, Date Column, Geo Column, Historical Start Date, Historical End Date, and KPI Column.
Step 3: Market Selection
Once your data is validated, you will proceed to select your test and control markets. Lifesight helps you identify optimal market sets based on your historical data.
Understanding Test and Control Markets
In a geo experiment, Test Markets are the locations where the experiment's treatment (e.g., new campaign, increased spend) is applied. Control Markets are similar locations where the treatment is not applied, serving as a baseline for comparison.
Automatic Market Selection
Based on your historical data, Lifesight's platform will propose the best-suited test market sets for your experiment.
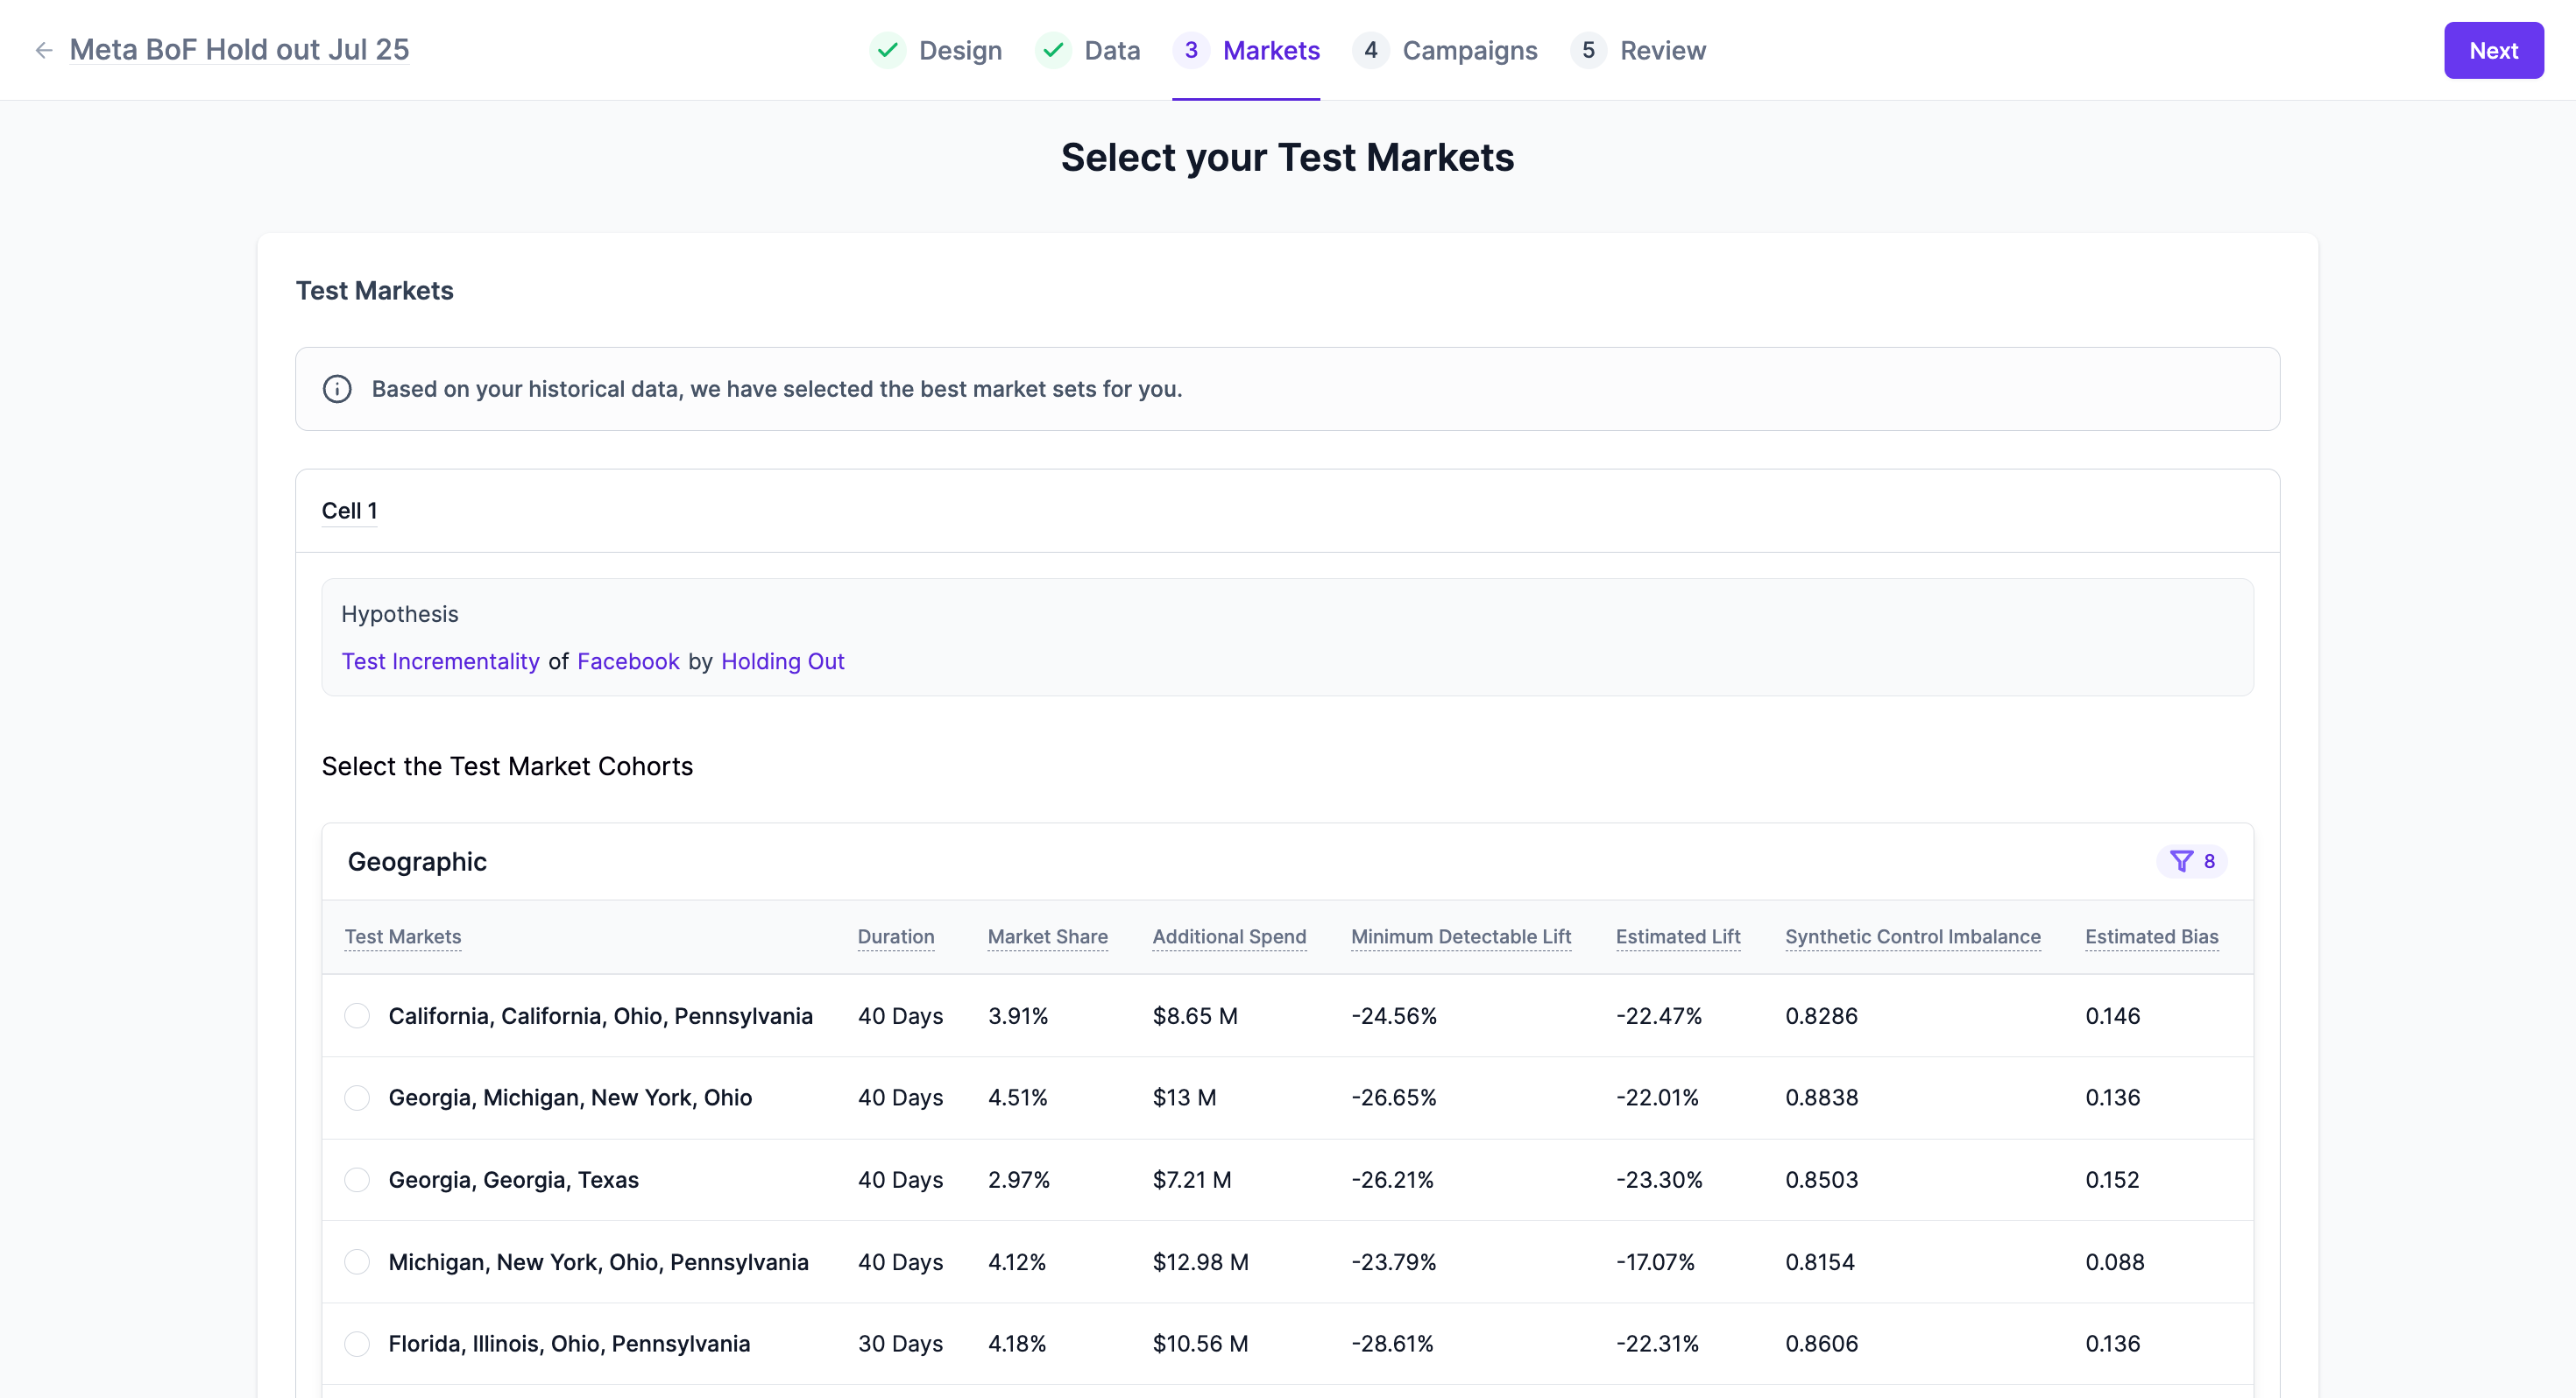
Reviewing Market Cohorts
You can review the suggested market cohorts for each cell of your hypothesis. Details provided include:
- Test Markets: The specific geographic locations designated as test markets (e.g., Arkansas, South Carolina).
- Duration: The recommended duration for the experiment in these markets.
- Market Share: The percentage of market share represented by these markets.
- Additional Spend: The estimated additional spend for the experiment in these markets.
- Minimum Detectable Lift: The smallest percentage lift that the experiment is capable of detecting.
- Estimated Lift: The projected lift from the experiment.
- Synthetic Control Imbalance: A metric indicating the balance between test and synthetic control markets.
- Estimated Bias: An estimation of potential bias in the market selection[cite: 4].
- Control Markets: A breakdown of the geographic locations forming the synthetic control group and their respective weights.
You can view the Time Series Decomposition chart, below the market selection table to observe historical data trends for both control and treatment groups, which helps ensure the validity of your market selection.
Step 4: Campaign Deployment
This step involves linking your Lifesight experiment to active campaigns on integrated ad platforms. Currently, Lifesight supports campaign deployment for Google and Meta ad platforms.
Integrating with Ad Platforms
Ensure your Google and Meta ad accounts are integrated with Lifesight. This allows the platform to adjust and monitor campaigns based on your experiment design.
Mapping Campaigns to Experiment Cells
Within the "Campaigns" section, you will map your active campaigns to the respective "Cell 1" (and any other cells) defined in your hypothesis. This ensures that the chosen campaigns are correctly associated with the treatment and control groups for accurate measurement.
Step 5: Experiment Review
The final step before launching your experiment is a comprehensive review of all the configurations. This page provides a summary of your experiment design, data selection, market cohorts, and campaign mappings.
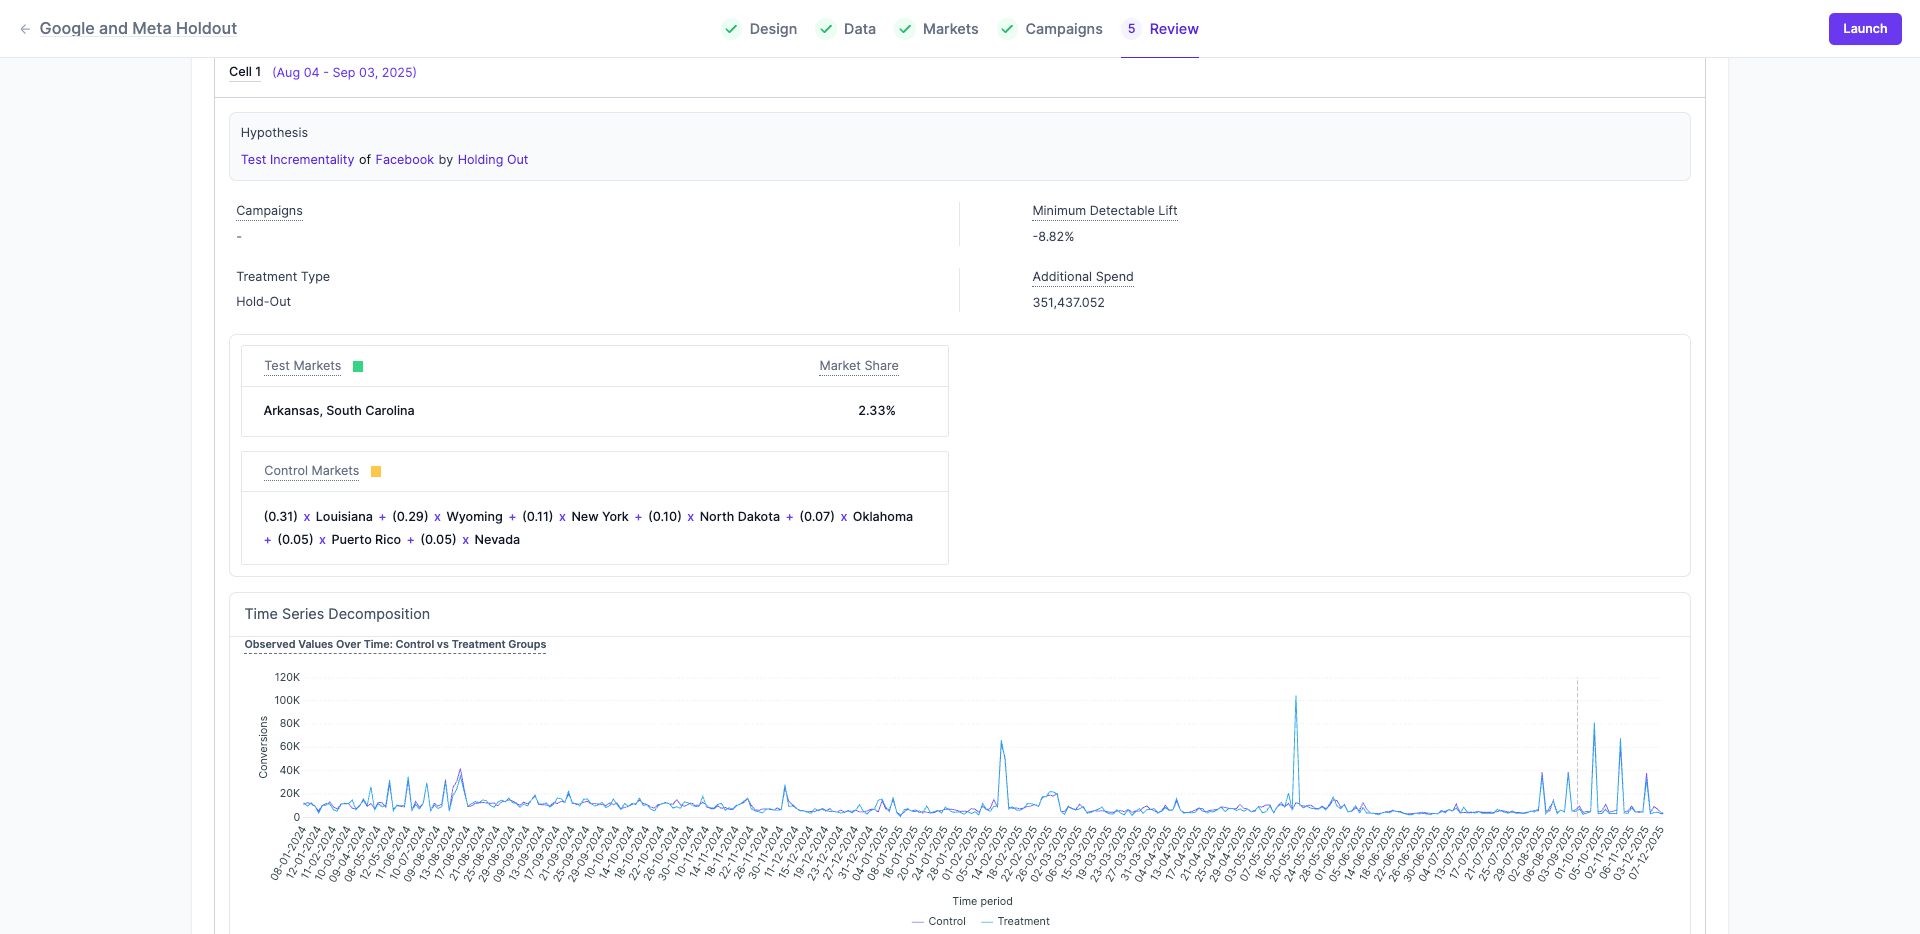
On the review page, you will see a consolidated view of:
- Cell Details: Including the hypothesis, treatment type, minimum detectable lift, and additional spend.
- Test Markets: The selected markets and their market share.
- Control Markets: The detailed breakdown of the synthetic control group composition.
- Time Series Decomposition: A visual representation of observed values over time for both control and treatment groups.
Review all the details carefully. If everything looks correct, you can proceed to launch your experiment.
Updated 10 months ago