Campaigns
Understanding campaign level insights
The Campaigns tab provides the most granular view of your Marketing Mix Model (MMM) results. After the model processes all your marketing and sales data, this is where you can see precisely how it attributes performance to each individual campaign. Use this view to identify your most effective marketing activities, understand their true incremental impact, and inform your future campaign-level budget allocation strategies.
Page Filters
At the top of the page, you have two primary filters to refine the data shown in the table:
- Date Range: Select the specific time period you want to analyze. The table will update to show only the campaigns and performance data from within this range.
- Platform(s): Filter the view to see campaigns from one or more specific marketing platforms (e.g., Google Ads, Meta, Linkedin).
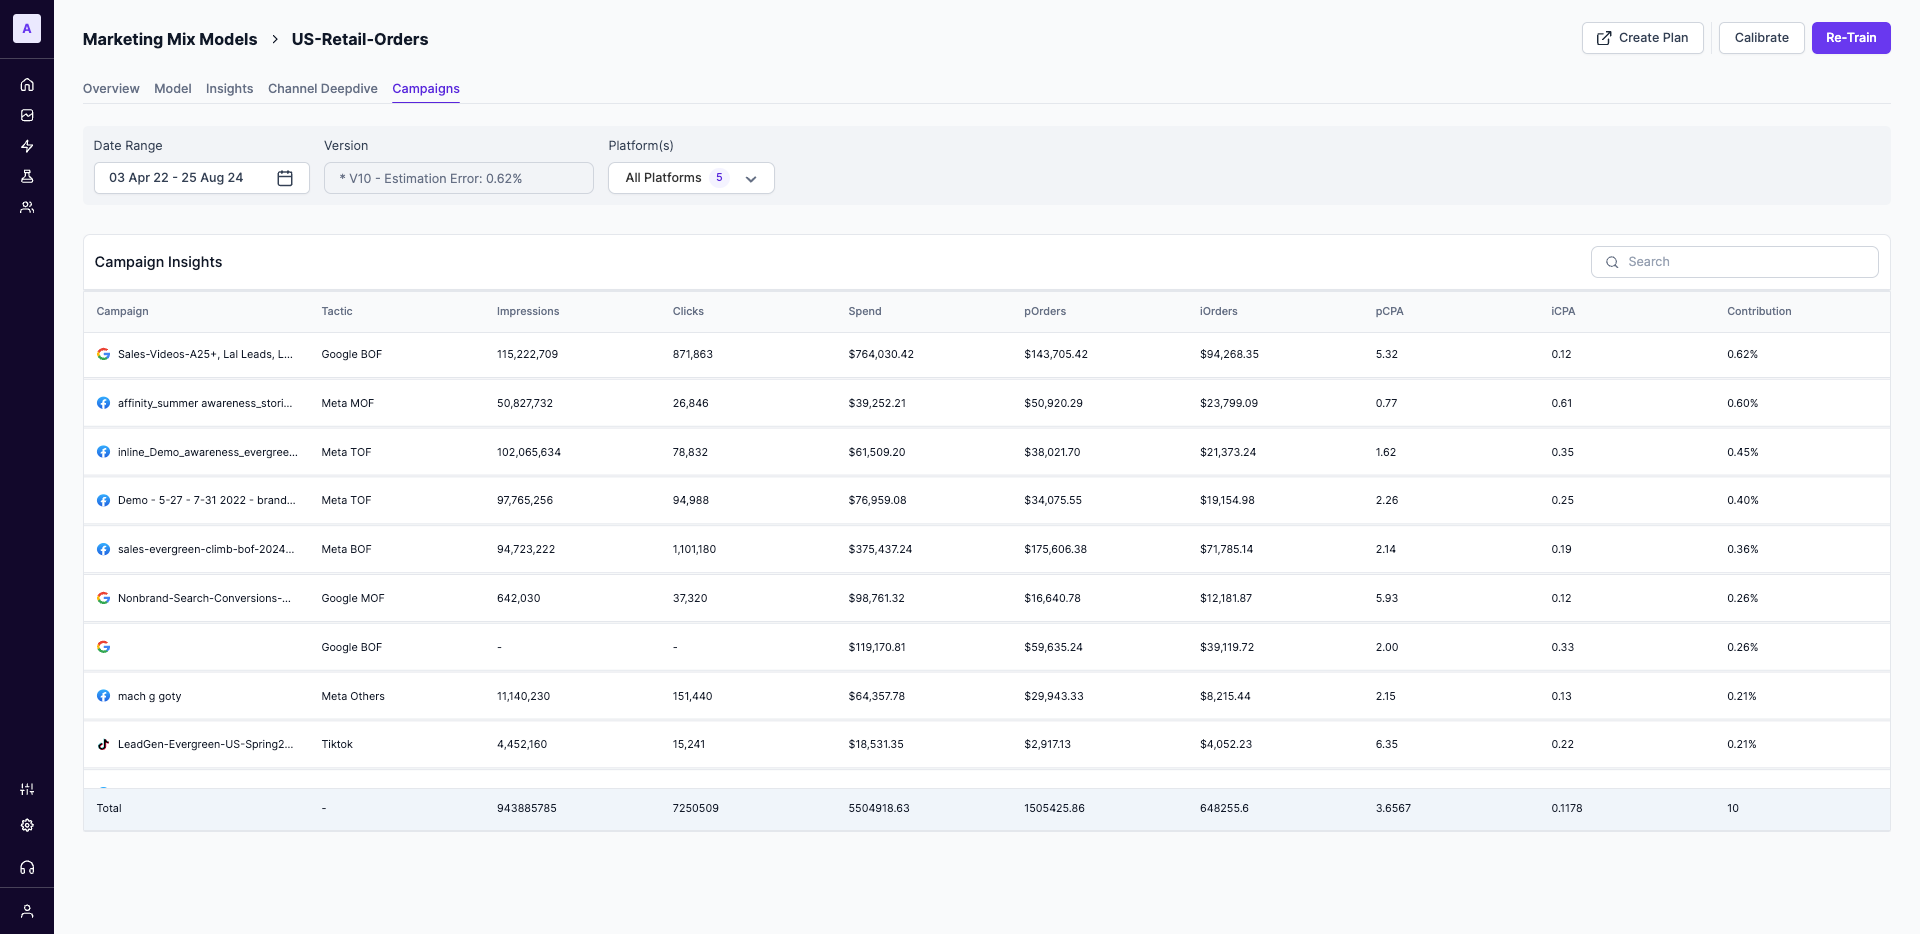
Interpreting the Campaign Insights Table
This table is the core of the Campaigns tab, breaking down the performance of each campaign according to the model.
Campaign & Tactic
Campaign & Tactic- Campaign: This is the name of the campaign as it appears in the source platform (e.g., "gales-videos-a2f-lat_leads_l...").
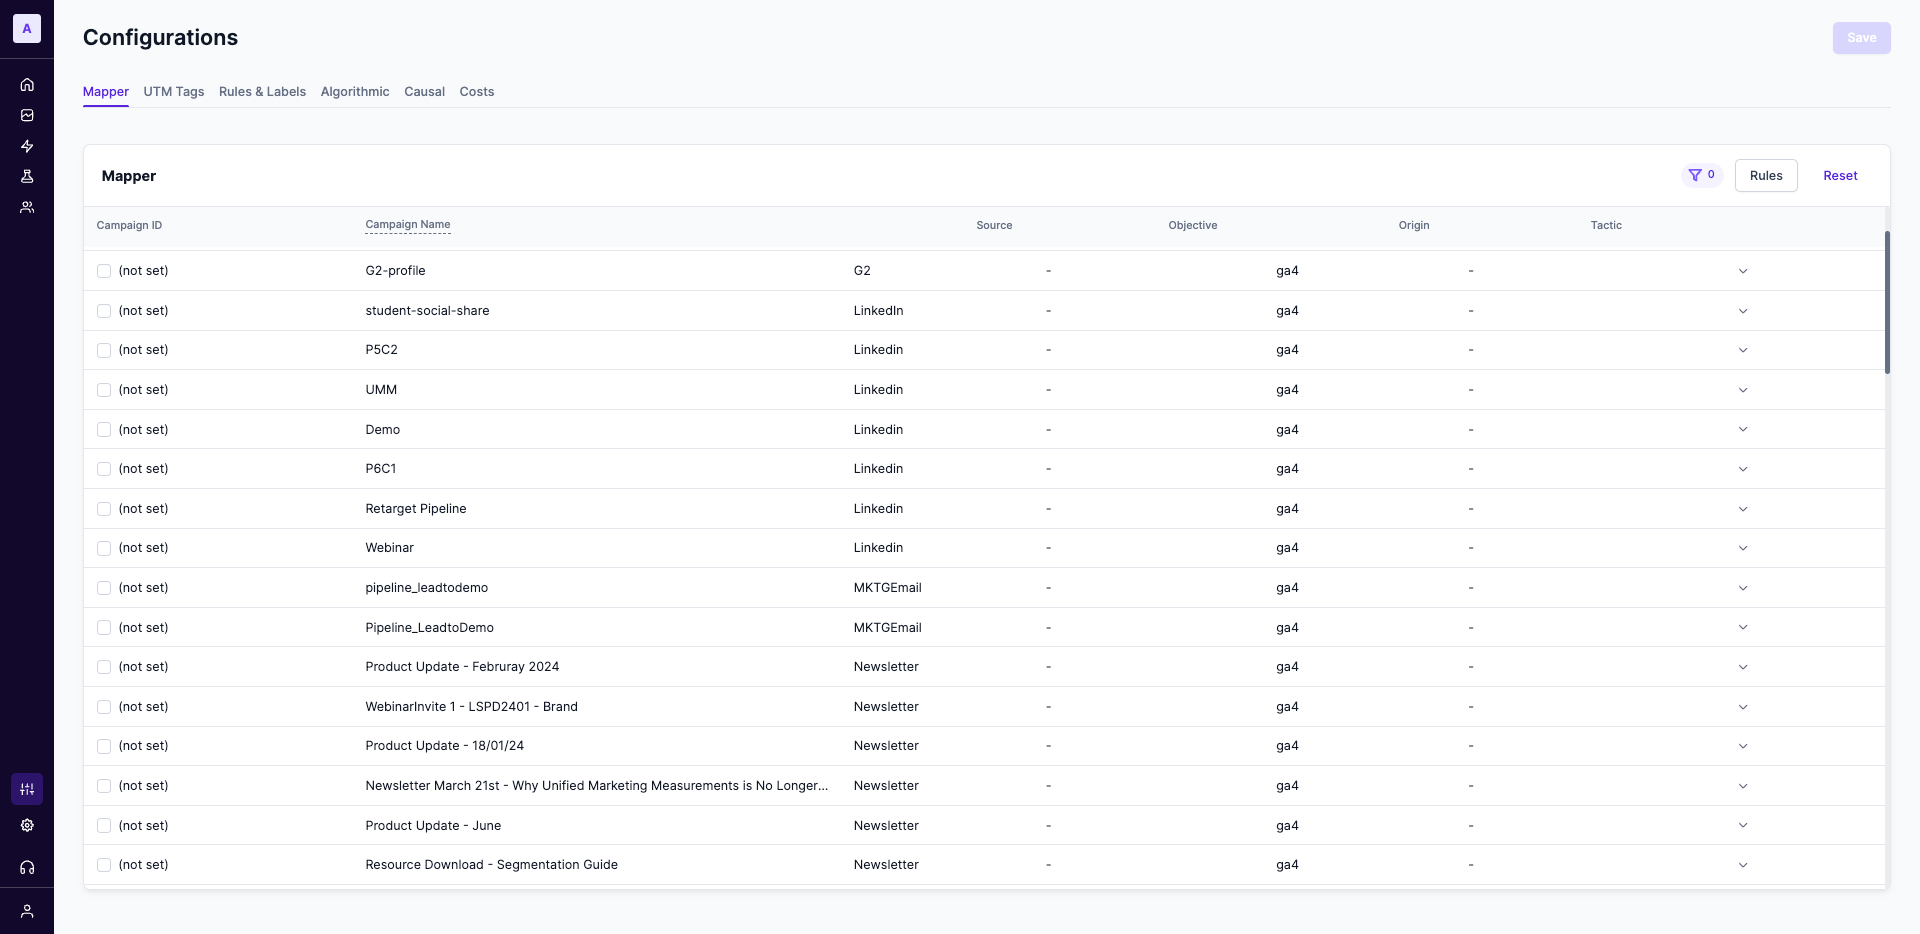
- Tactic: This is a powerful, user-defined dimension that allows you to group similar campaigns for analysis. As seen in the screenshot, this is commonly used to classify campaigns by their strategic purpose or funnel stage (e.g.,
Google BOF,Meta MOF,Meta TOF). This is configured by setting up rules in the Configurations > Mapper section of the Lifesight platform.
Input Metrics
These columns represent the raw input data that is fed into the model for each campaign:
- Impressions: The total number of times the campaign's ads were shown.
- Clicks: The total number of clicks on the campaign's ads.
- Spend: The total amount of money spent on the campaign during the selected date range.
Platform vs. Incremental MetricsTo accurately measure marketing, the Lifesight UMM Platform distinguishes between two types of results. Understanding this difference is critical for making effective decisions.
- Platform Metrics (p): Represents the outcomes reported directly by the advertising platform's native tracking (e.g., your Meta Pixel or Google Ads tag). This is what the platform claims the campaign achieved, but it often ignores offline activities and external factors, resulting in an incomplete view.
- Incremental Metrics (i): This is the most important metric for measurement. It represents the outcomes that the MMM model has determined happened only because the campaign ran. It is the true, additional value your marketing delivered, creating a more accurate, granular, and holistic estimate.
Platform Outcomes (pOrders & pCPA)
pOrders & pCPA)- pOrders: The total number of "platform" orders as reported directly by the source advertising platform's tracking.
- pCPA: The "platform" Cost Per Acquisition, calculated as
Spend / pOrders.
Incremental Outcomes (iOrders & iCPA)
iOrders & iCPA)These metrics represent the true, causal impact of your campaigns as determined by the model.
- iOrders: The number of "incremental" orders. These are the orders that would not have occurred without this specific campaign. This is your measure of true marketing-driven impact.
- iCPA: The "incremental" Cost Per Acquisition, calculated as
Spend / iOrders. This is often considered the true CPA of your marketing efforts, as it is based only on the sales that were a direct result of your investment.
Contribution
ContributionThis column shows the percentage of total incremental orders (iOrders) that each campaign is responsible for across all the campaigns shown in the table. It's a quick way to see which campaigns are the biggest drivers of incremental growth. For example, if a campaign shows a contribution of 0.62%, it means it generated 0.62% of the total additional orders delivered by your marketing efforts in the selected view.
Updated 12 months ago