Geo Experiments - Insights & Validation
Important metrics
Treatment Spend
The total investment allocated to the treatment geographies where the experiment campaign is active is captured here. This metric aggregates all campaign-related costs incurred during the experiment.
Treatment Conversions
This metric records the number of conversion events—such as revenue, purchases, sign-ups, or other desired actions—that occur within the treatment regions. It reflects the direct outcomes of the applied intervention and is critical for assessing the campaign's effectiveness in driving conversions.
Control Spend
Representing the spending in control geographies where the intervention is not applied, this metric serves as a baseline for comparison. It allows for an evaluation of how the treatment investment differs from standard or natural spending patterns
Control Conversions
This metric indicates the number of conversions occurring in the control areas during the experiment. By establishing a performance baseline, it enables a comparative analysis against the treatment group to isolate the incremental impact of the intervention.
Lift
Absolute Lift: This is the raw difference in conversions (or other key outcomes) between the treatment and control groups. It provides a straightforward measure of the additional outcomes generated by the intervention.
Percentage Lift: This is calculated by expressing the absolute lift as a percentage relative to the control group’s performance. It normalizes the impact, allowing for meaningful comparisons across different experiments or market segments by indicating the proportional improvement driven by the treatment.
iROAS or iCPA
This incremental metric is derived by analyzing the difference between the additional revenue generated and the additional spend in treatment versus control geographies.
Incremental ROAS (iROAS) is calculated as the (difference in revenue between treatment and control) divided by (difference in spend between the treatment and control).
Incremental CPA (iCPA), is calculated as the (difference in spend between the treatment and control) divided by (difference in conversions between treatment and control)
Confidence
The confidence metric provides a statistical measure indicating the likelihood that the observed lift is genuine and not a result of random variability. Typically expressed as a percentage (e.g., 95% confidence), it is derived from hypothesis testing and other statistical analyses. Higher confidence values suggest that the experimental results are statistically significant and that the observed differences between the treatment and control groups are reliable.
Understanding confidence
- Null Hypothesis (H₀)
Assumes that there is no difference between treatment and control groups, meaning the marketing campaign had no incremental impact. - Alternative Hypothesis (H₁)
Proposes that there is a statistically significant difference between treatment and control, implying the campaign resulted in incremental lift.
High Confidence (e.g., 90%+): Reject the null hypothesis H₀.
The observed lift is statistically significant and can be confidently attributed to the marketing intervention.
Low Confidence (e.g., below 90%): Fail to reject the null hypothesis, accept H₁
The observed lift might be due to chance or natural variance rather than the intervention.
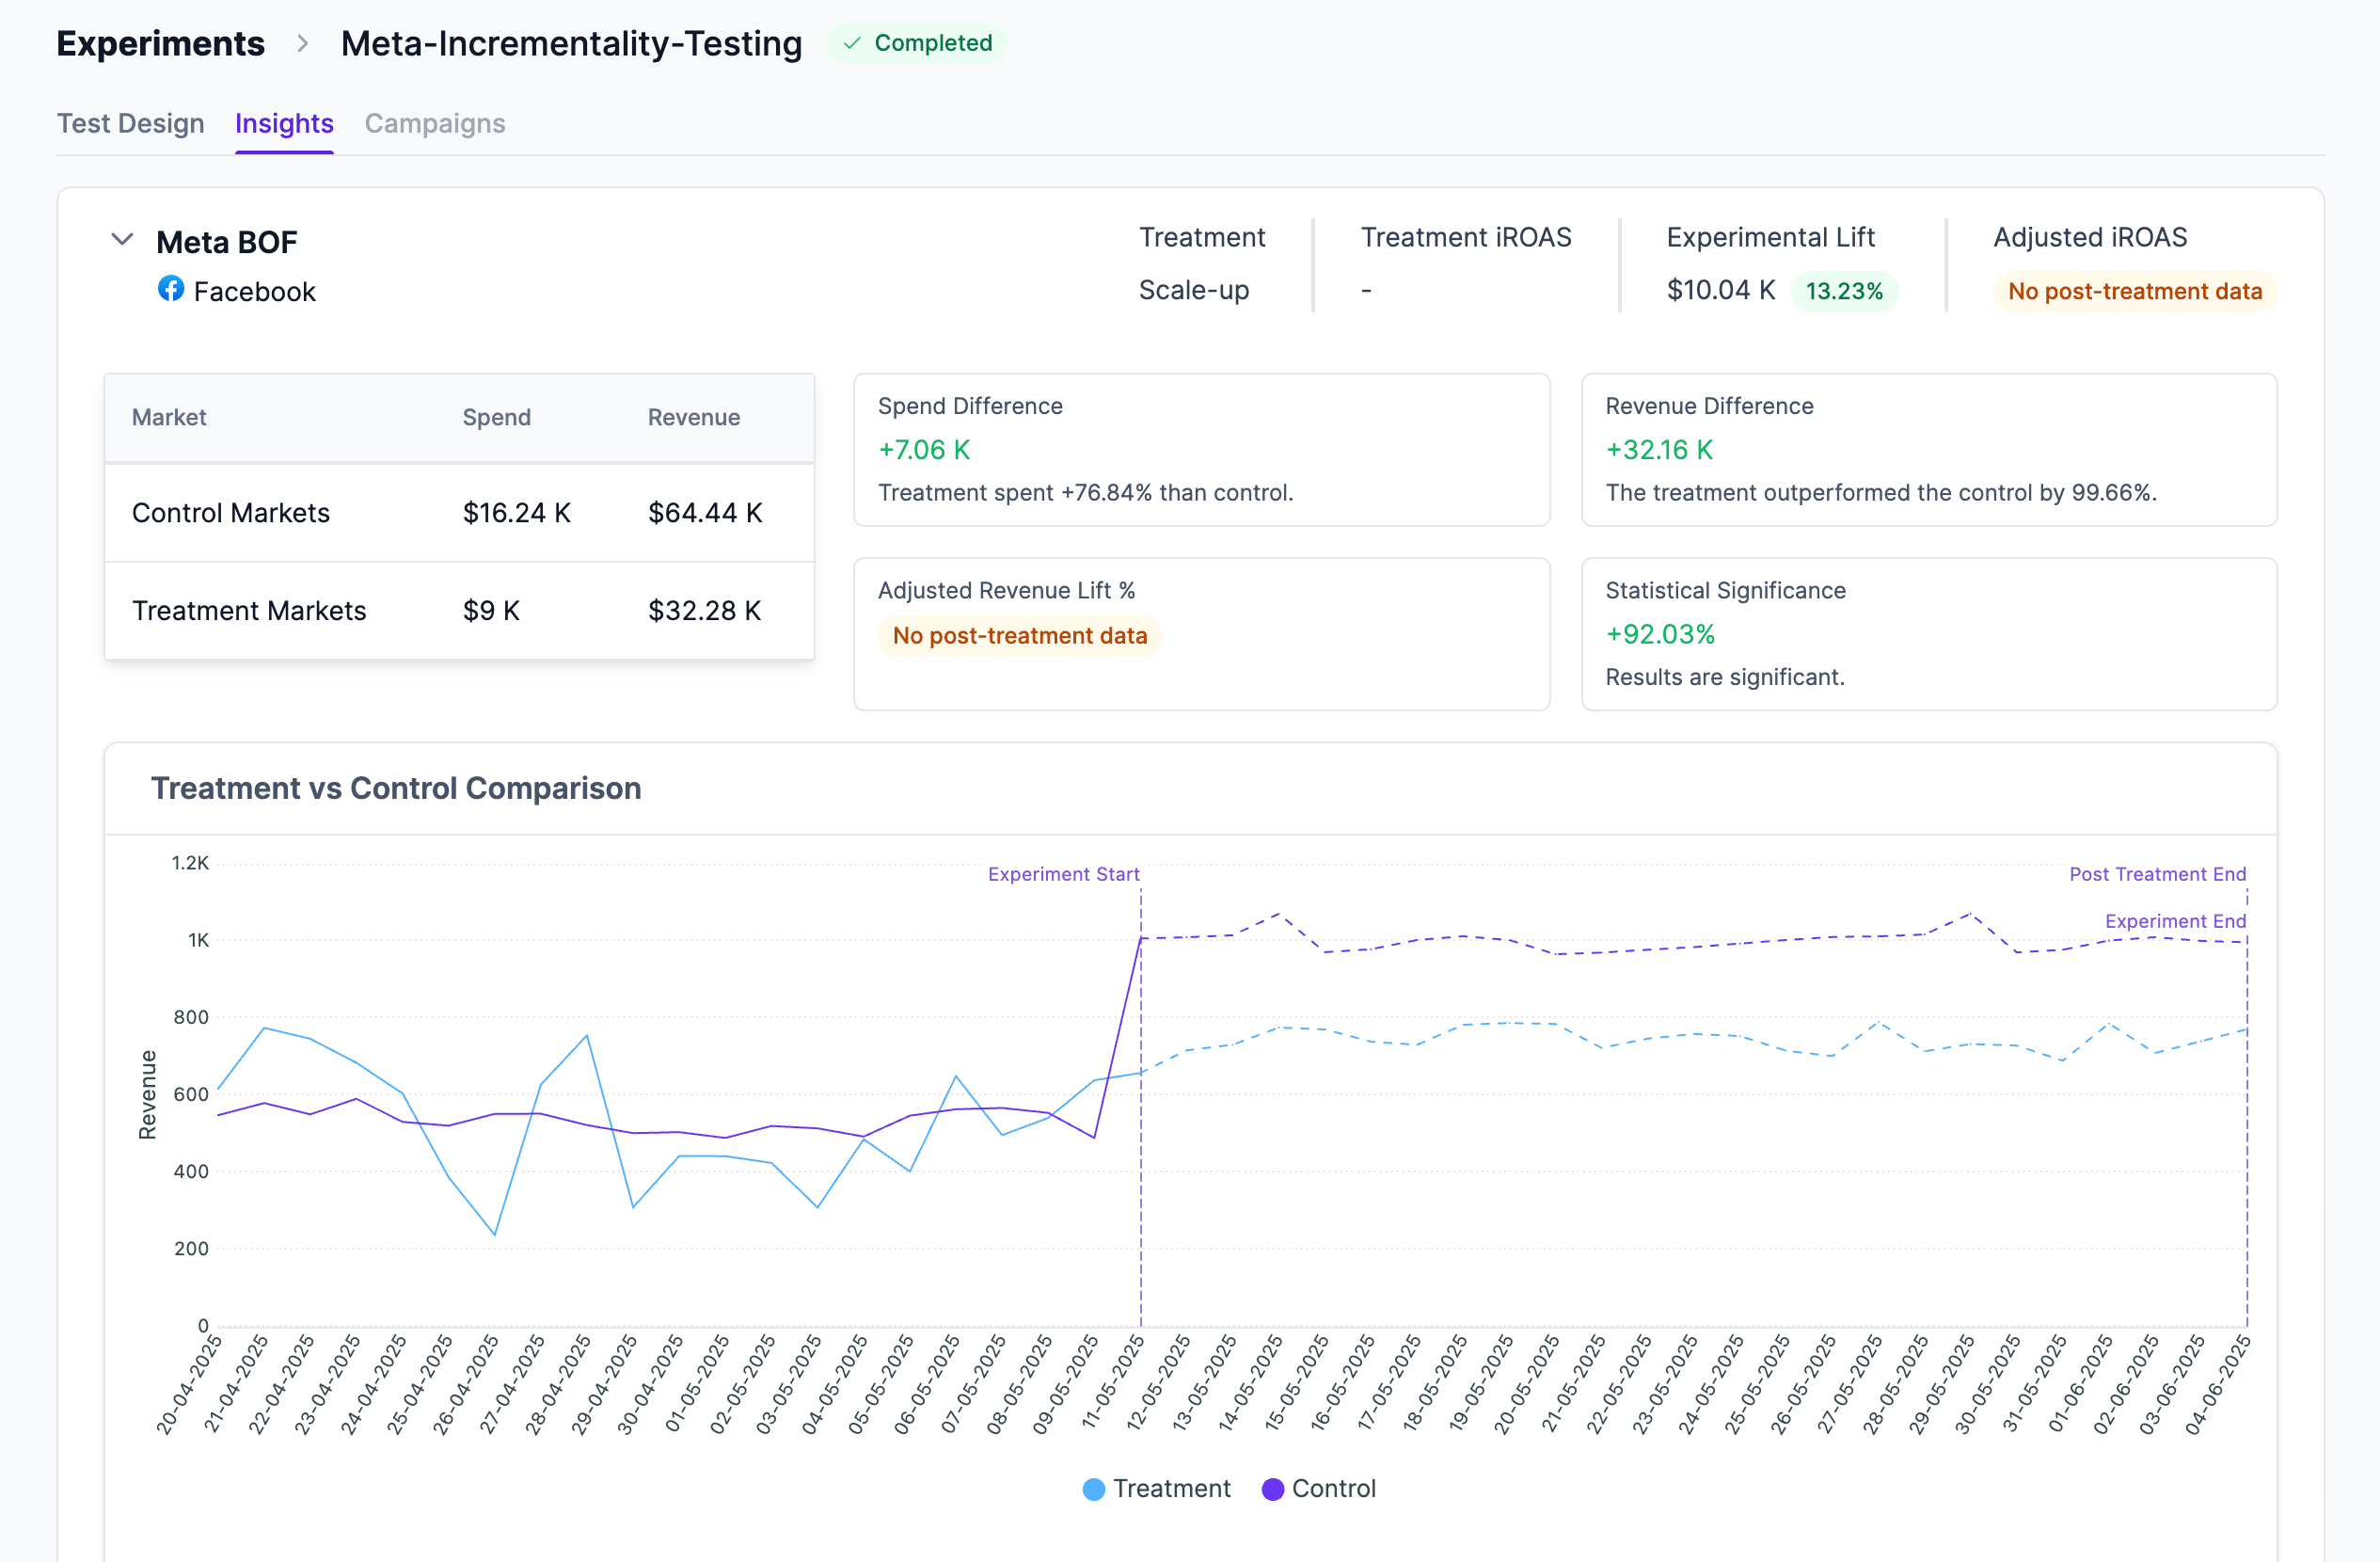
Fig. 1. Insights page with dummy data
Post-treatment window
It's important to include a post-experiment or post-treatment window to capture the delayed effects of advertising efforts, particularly when there's a significant lag between ad exposure and the resulting conversions.
Determining the Optimal Length:
The ideal duration of a post-treatment window varies based on factors such as the typical purchase cycle of the product or service and the nature of the advertising channel. For instance, products with longer consideration periods may require extended observation windows. As a rule of thumb, the post-treatment window is kept as 1X or 1.5X the experiment window.
This window lets us compute additional adjusted iROAS and iCPA numbers.
Adjusted Incremental ROAS (Adj. iROAS) is calculated as the (difference in revenue between treatment and control including the post-treatment period) divided by (difference in spend between the treatment and control including the post-treatment period).
Adjusted Incremental CPA (Adj. iCPA), is calculated as the (difference in spend between the treatment and control including the post-treatment period) divided by (difference in conversions between treatment and control including the post-treatment period)
Validation
| ERROR TYPE | WHAT IT MEANS IN A GEO EXPERIMENT | LIKELY ROOT CAUSES | HOW LIFESIGHT SOLVES FOR THIS |
|---|---|---|---|
| Type I (False Positive) | Conclude the intervention produced incremental conversions when the true effect is zero; report that “lift” that is just random noise | Mismatched or too-few control geos; seasonal or competitive shocks hitting test/control unequally; premature peeking at results; loose significance threshold; poor synthetic-control fit | Augmented synthetic control uses all non-treated geos to match pre-test trend, reducing bias; pre-test MAPE diagnostics flag bad fits; conformal inference calibrate p-values; market-selection algorithm picks splits with lowest expected prediction error |
| Type II (False Negative) | Fail to detect a real lift— the experiment declares “no effect” even though treated geos gained conversions | Too few test geos or insufficient spend; short test duration; noisy conversion KPI; small true effect below minimum detectable effect | Power-planning tools (Market selection, power functions) simulate duration, spend and geo count to reach ≥80 % power; synthetic control lowers residual variance, tightening confidence intervals |
Updated 8 months ago