How to select planning base period
Use seasonality, trends, and holidays to select the optimal forecasting base period
Overview
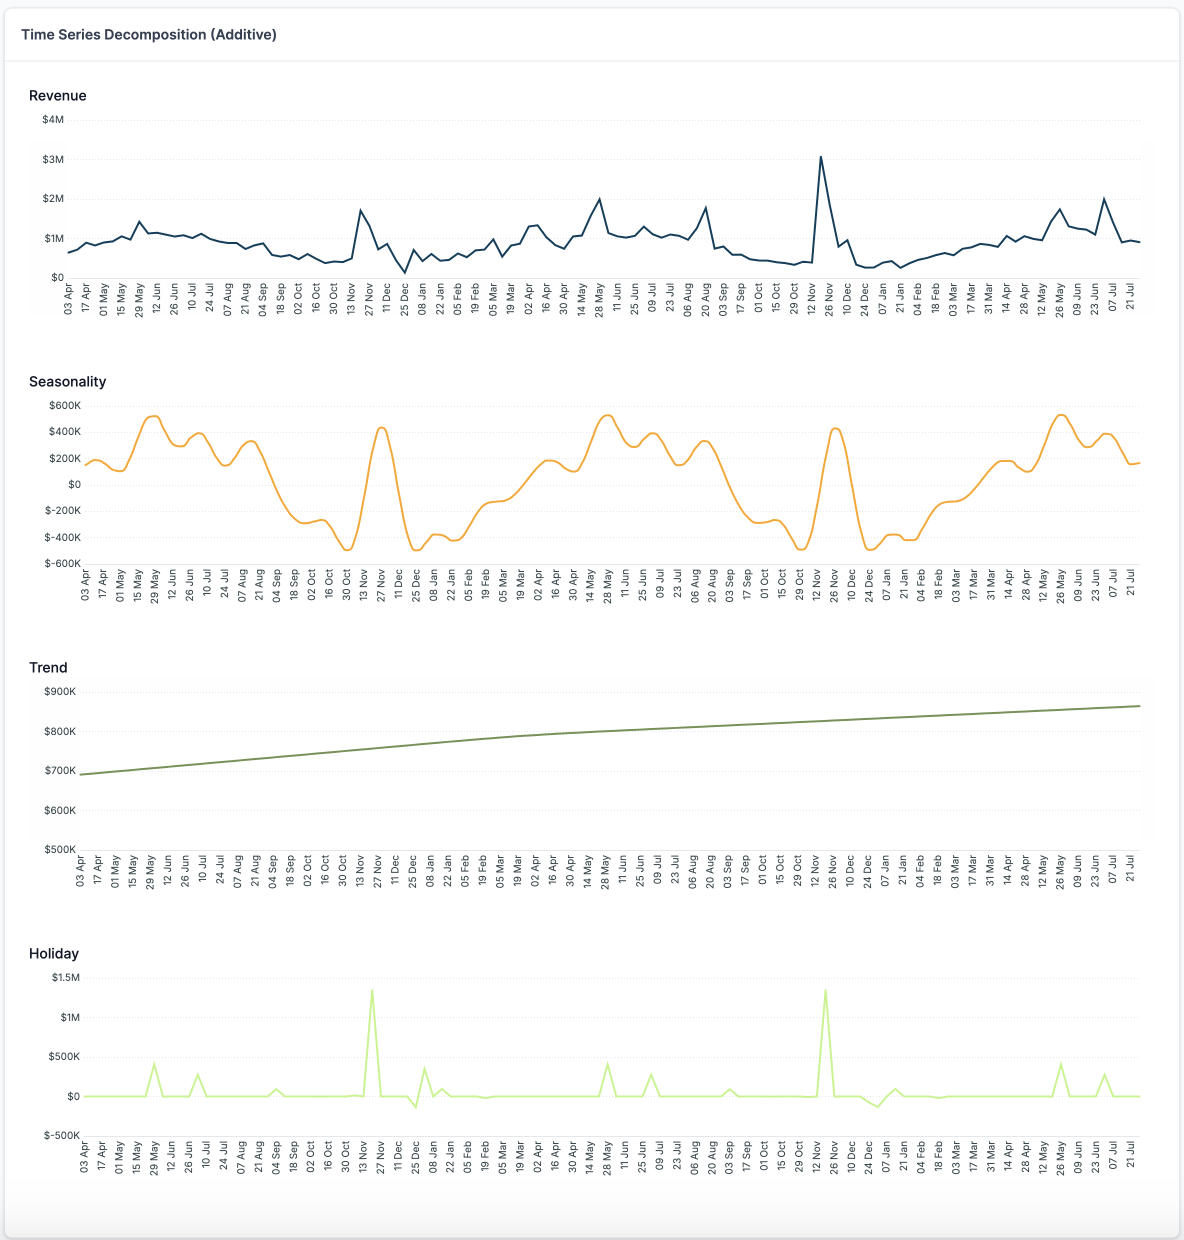
Selecting the optimal base period for forecasting involves understanding the underlying patterns in your data, including seasonality, trend, and holiday effects. Graphs that depict these elements can guide you in choosing a base period that will improve the accuracy of your forecasts. (Below graph is an example of that)
1. Understanding Seasonality
Seasonality refers to periodic fluctuations in data that occur at regular intervals, such as weekly, monthly.
Example :
The second graph (above) illustrates the seasonal component of the data:
-
Clear cyclical pattern that repeats annually
-
Peaks around $400K to $600K
-
Troughs around -$400K to -$600K
-
This pattern suggests strong yearly seasonality in the revenue data.
In these cases, you can select the
past year same monthas theoptimize based onperiod for forecasting.
Note: Our model can identify seasonality and trends in your data and provide you with a comprehensive chart.
2. Analyzing Trend
Trend represents the long-term direction in the data, indicating whether values are generally increasing or decreasing over time.
Example :
The third graph shows the overall trend of the revenue:
- A gradual, steady increase over time
- Starts around $700K at the beginning of the period
- Ends around $850K by the end of the period
- This indicates a slow but consistent growth in the underlying business
3. Identifying Holiday Effects
Holiday Effects are anomalies or deviations from normal patterns that occur around holidays or special events.
Example :
- The bottom graph represents the impact of holidays or special events:
- Mostly flat around $0, indicating no effect for much of the year
- Occasional sharp spikes, with two major ones reaching about $1.5M
- These spikes likely correspond to specific holidays or events that dramatically boost revenue
Overall Recommendation:
If you are forecasting for a month or quarter :
- If the data is seasonal and there is a flat trend: You take last year's same month as the base period.
- If the data is seasonal and there is an additive trend: You can either take last year's same month as the base period or the latest month as the base period.
- If the data is not seasonal and there is an additive trend: Take the latest month as the base period.
- If the data is not seasonal and there is a flat trend: Take the latest month as the base period.
Note
- You can understand why the proper base period is required, here.
- If you are not able to figure out the proper base period, please reach out to [email protected] or the respective account manager assigned to you.
Updated over 1 year ago