How to optimize your budget
In Marketing Mix Modeling (MMM), budget constraints refer to the predefined limits on how much spending can be adjusted—either increased or decreased—across specific media channels. These constraints are critical in shaping the allocation of the overall budget, directly impacting the optimization process and the effectiveness of the advertising strategy.
The budget optimizer within the MMM framework can be configured to optimize spending for either a monthly or quarterly period, depending on the campaign's scope and goals.
Insights
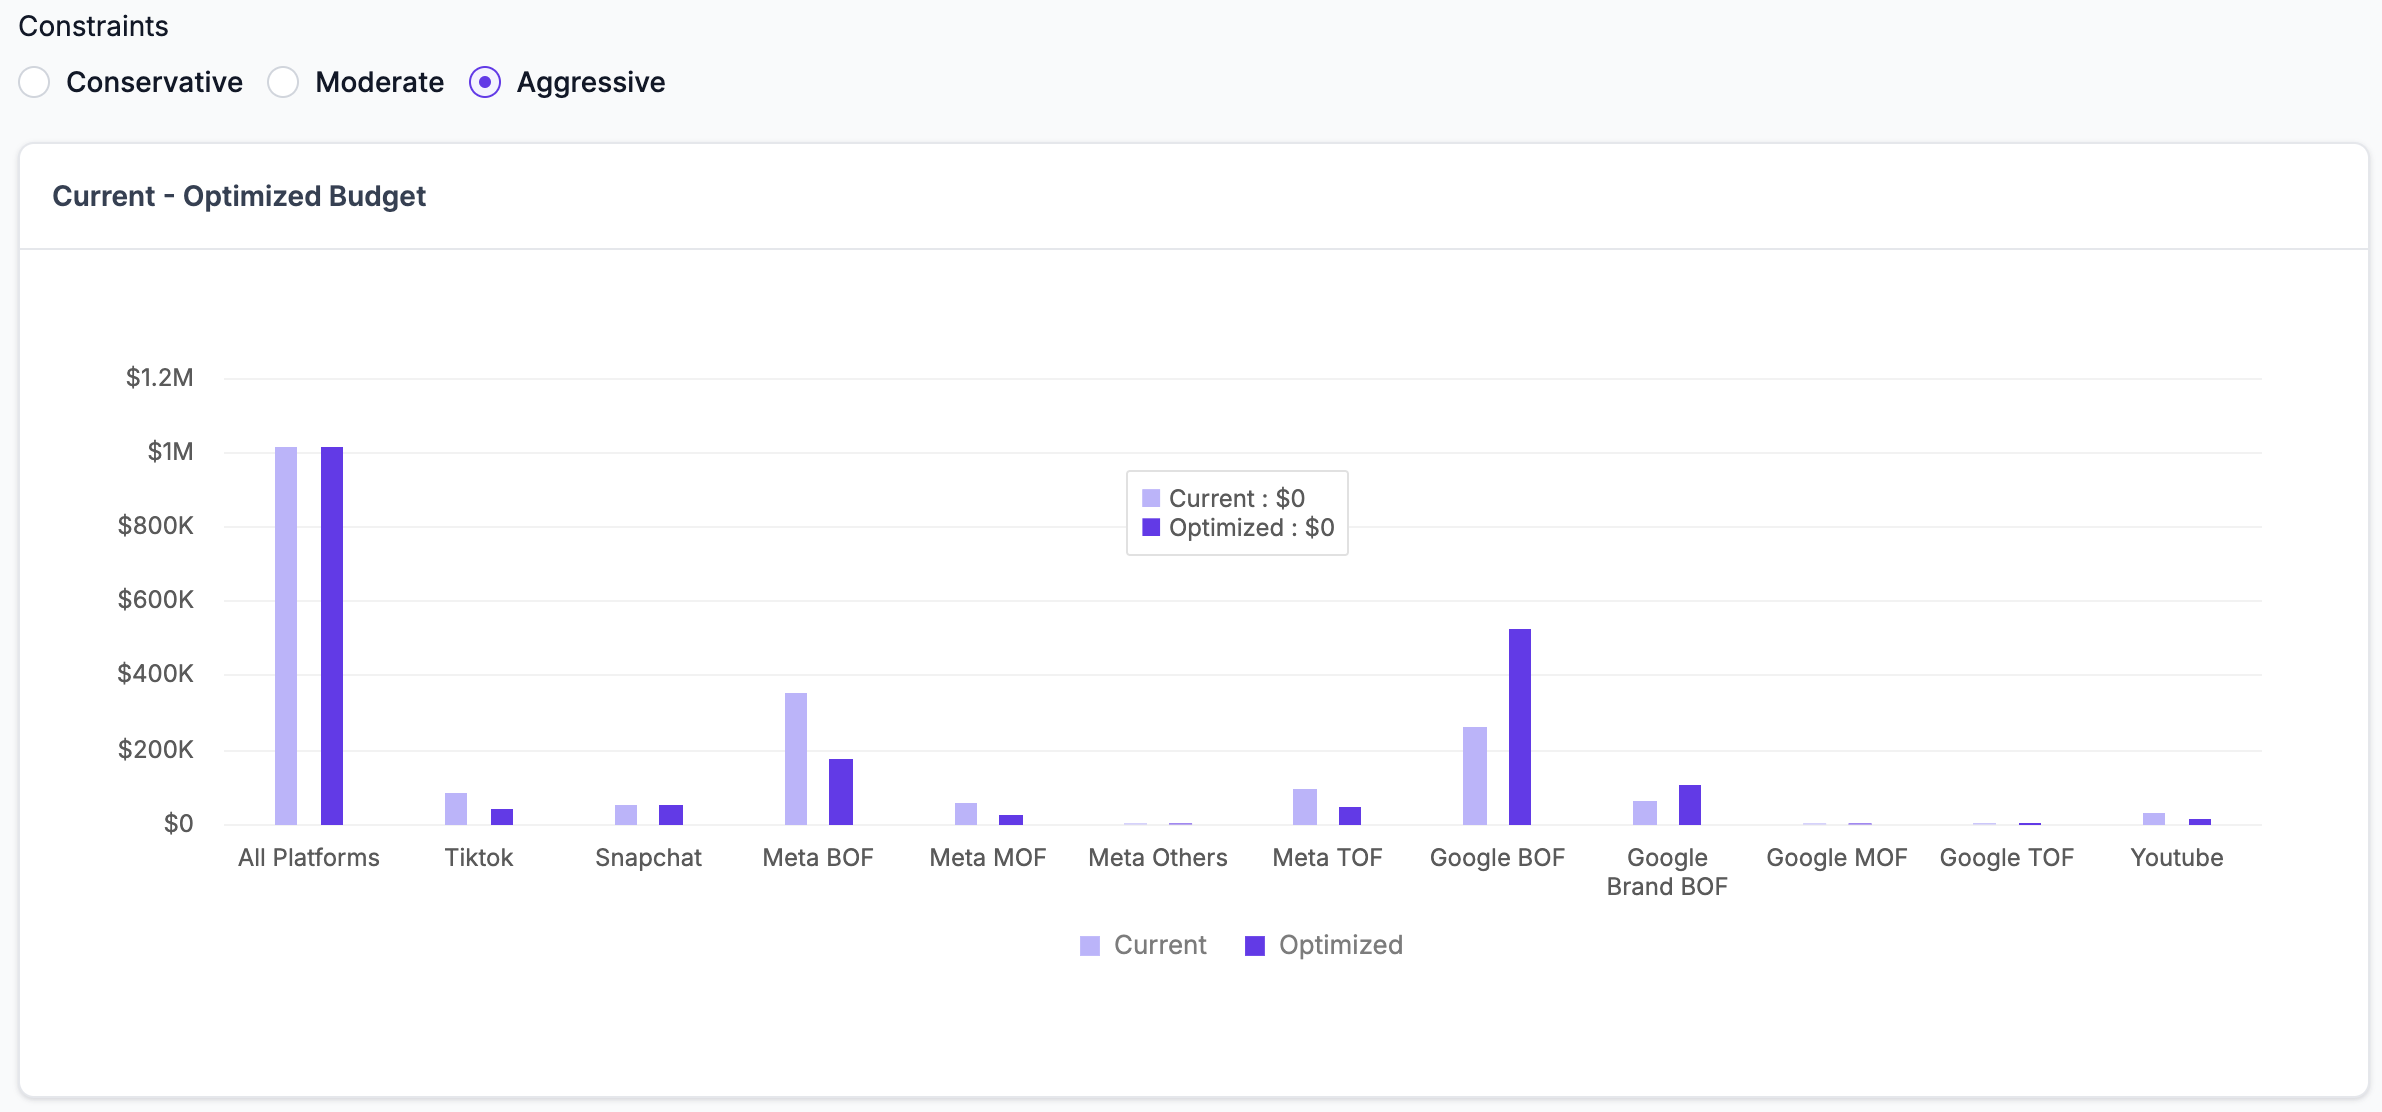
The Current vs. Optimized Budget plot provides a comparative view of the existing overall spend alongside the recommended optimized spend across various channels. The optimization process may suggest increasing the budget for certain channels while reducing it for others, depending on their respective performance and potential for returns. Additionally, different constraints can be applied based on the specific business context, allowing for a tailored approach to budget optimization that aligns with strategic objectives.
Saturation vs. Diminishing Curve
The Saturation Curve represents the point at which additional marketing spend yields diminishing returns. As investment in a particular channel increases, the incremental impact on sales or other key performance indicators (KPIs) begins to level off, indicating that the market is becoming saturated with the message. At this stage, further spend does not proportionally increase the desired outcome, signaling that the effectiveness of the marketing effort is reaching its limit.
In Marketing Mix Modeling (MMM), understanding the Saturation vs. Diminishing Curve is crucial for optimizing budget allocation across different channels. By modeling these curves, businesses can determine the point at which increasing spend in a particular channel no longer delivers proportional returns, allowing them to reallocate resources to more efficient channels or strategies. This insight is essential for maximizing the overall effectiveness of marketing efforts while avoiding unnecessary overspending.
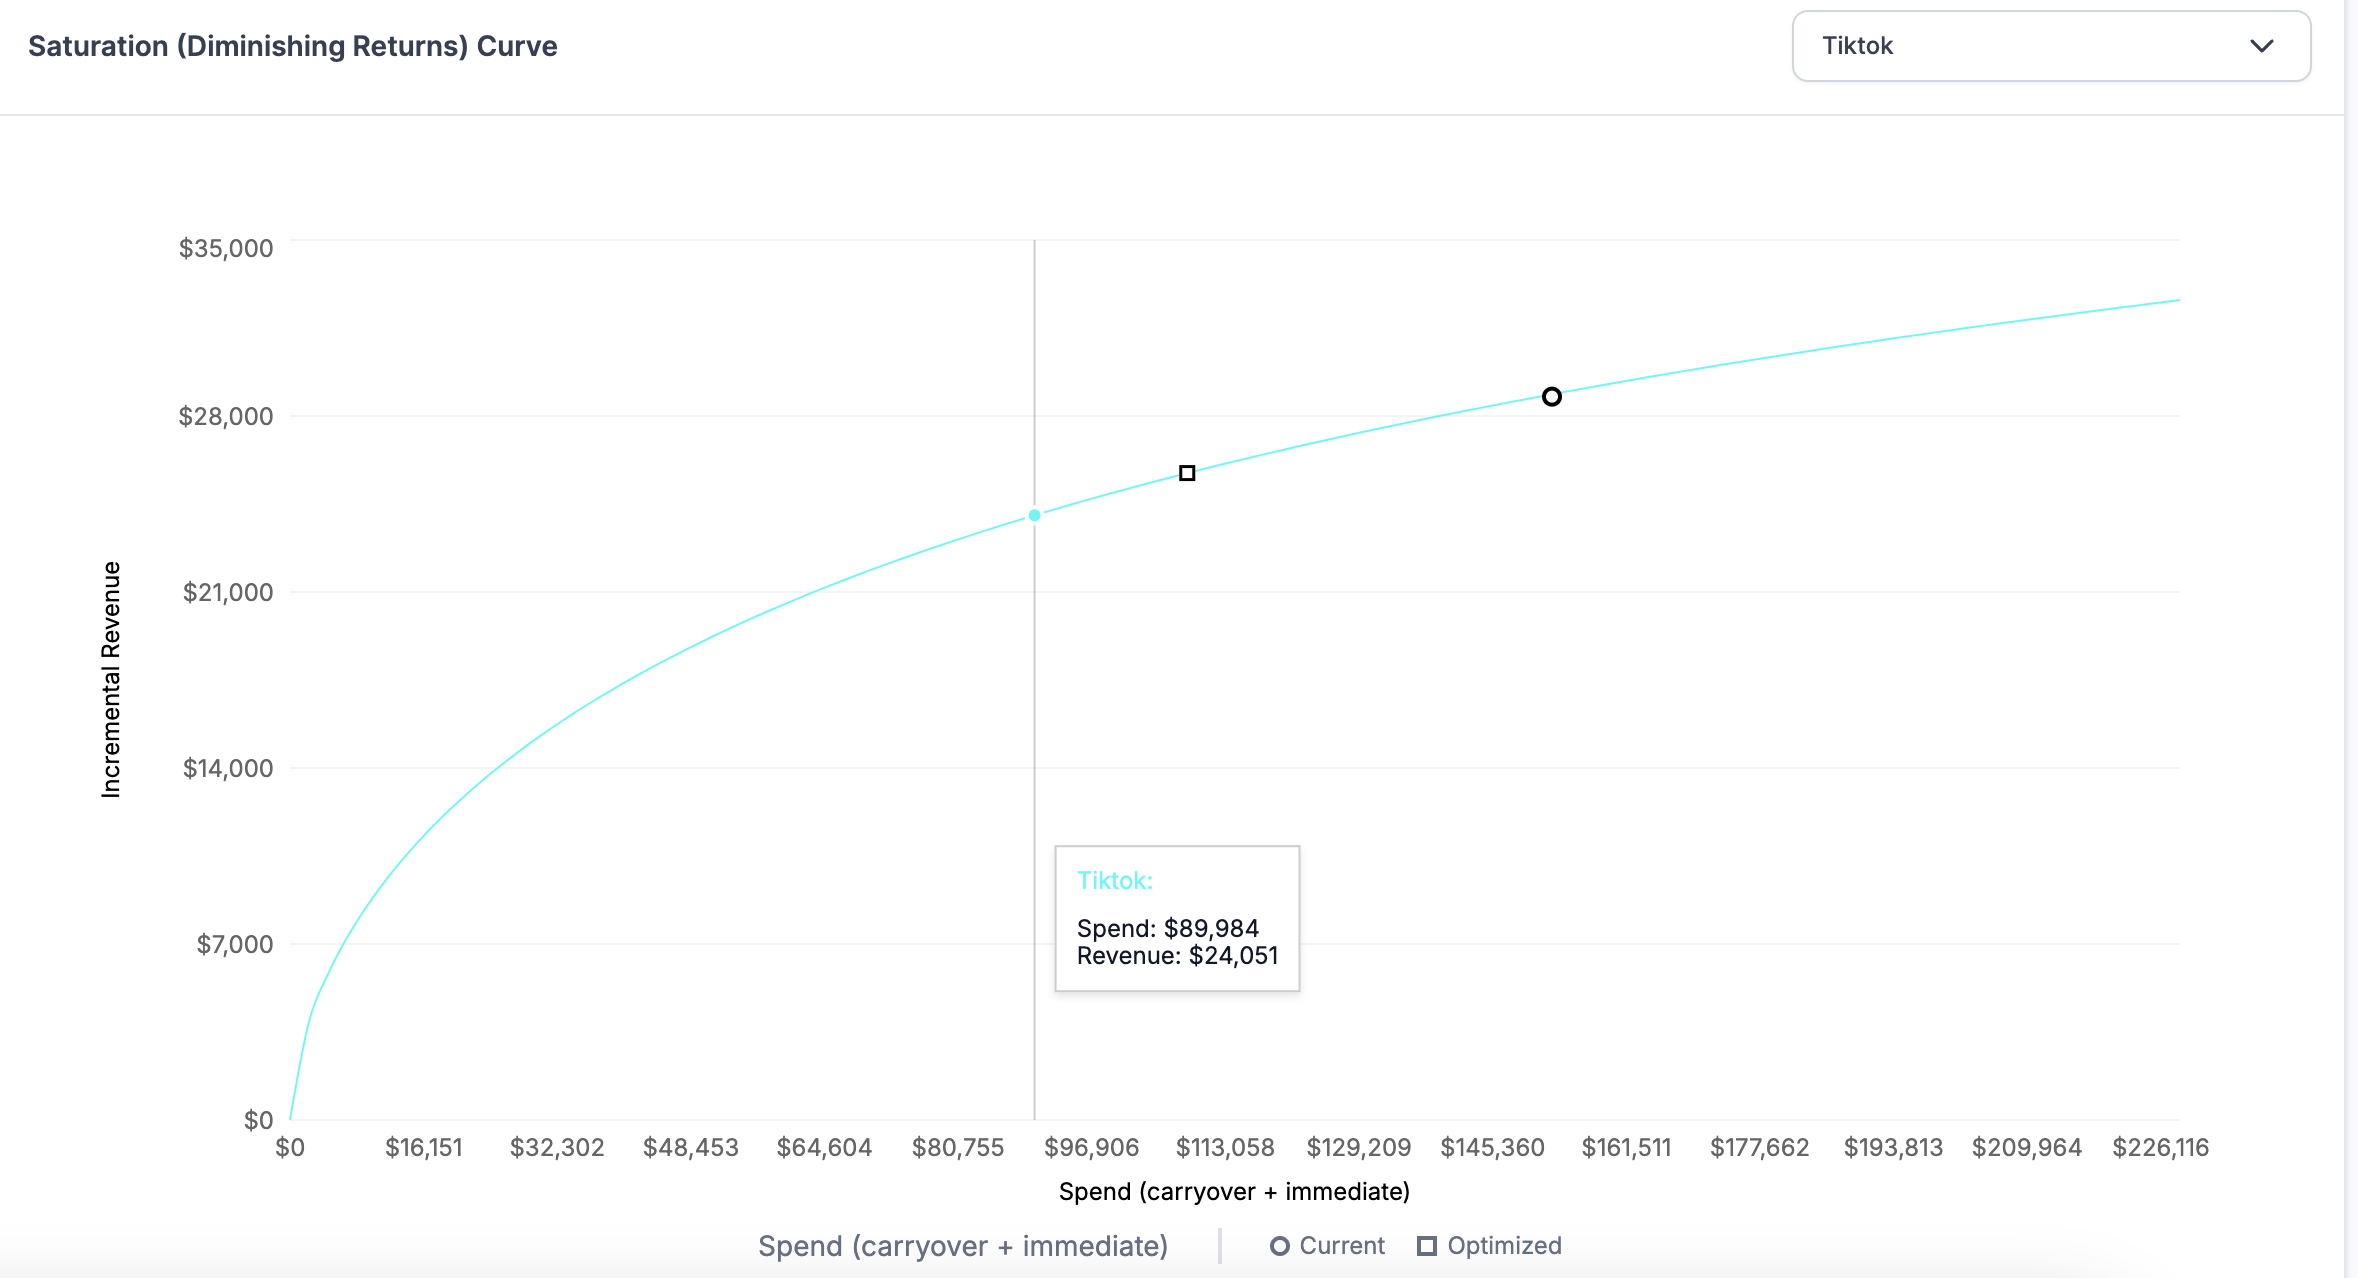
The Saturation Curve for each channel provides valuable insights into the effectiveness of current spending levels. In this analysis, circles represent the current spend, while squares denote the optimized spend. If the current spend exceeds the optimized spend for a particular channel, it indicates that spending should be reduced for that channel. Conversely, if the current spend is below the optimized spend, an increase in spending is recommended.
When a channel reaches its saturation point—indicated by the optimized spend aligning with the current spend and the curve flattening—it signifies that further investment in that channel will yield no additional benefit. In such cases, it is advisable to halt spending in that channel as it has maximized its potential impact.
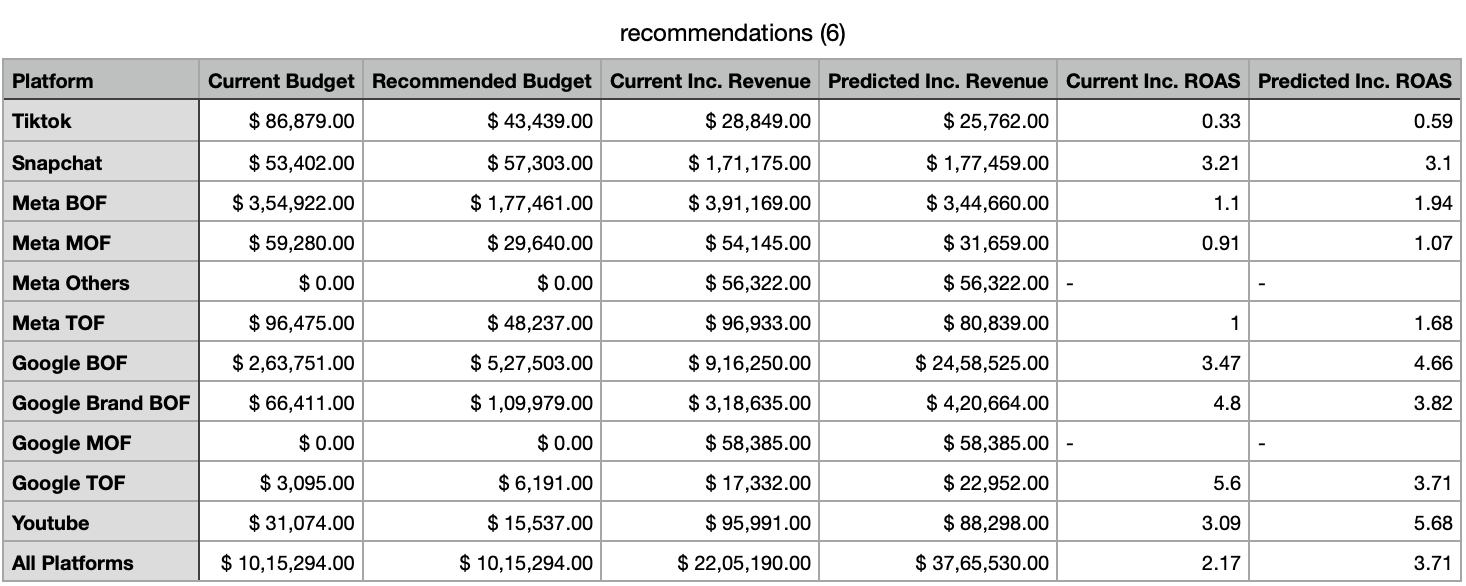
The Budget Optimizer generates a recommended worksheet based on the saturation analysis. This worksheet summarizes the optimal budget allocation strategies to maximize Key Performance Indicators (KPIs) in future periods, ensuring that marketing spend is effectively planned and allocated for optimal results.
Budget Worksheet
Updated over 1 year ago