Setting up your Mix Model
Your guide to configuring data, selecting variables, and launching your media mix model
Data Requirements
To ensure a successful model build, your data must be correctly prepared. You can provide data to the Lifesight platform through two methods:
Using Integrated Data
To create a model with an automated workflow, you can connect your data sources directly to the platform. To do this, you connectors from the integrations section in the Lifesight platform. Once your integration is active, choose Using Integrated data in the upload section to automatically pull all your input data from integrated platforms.
Using a CSV File
While the recommended method to create a model is using Integrated data, you can also kickstart your model with historical data stored in a CSV file. To ensure the model is built successfully, it must meet the certain conditions to prevent errors during the model creation process.
Refer to this page for a more details on data requirements for CSV file input.
Interactive Demo
View a step-by-step walkthroughUse the interactive demo below to guide you through each step of the model creation process
Step 1: Create a new Model and Upload Data
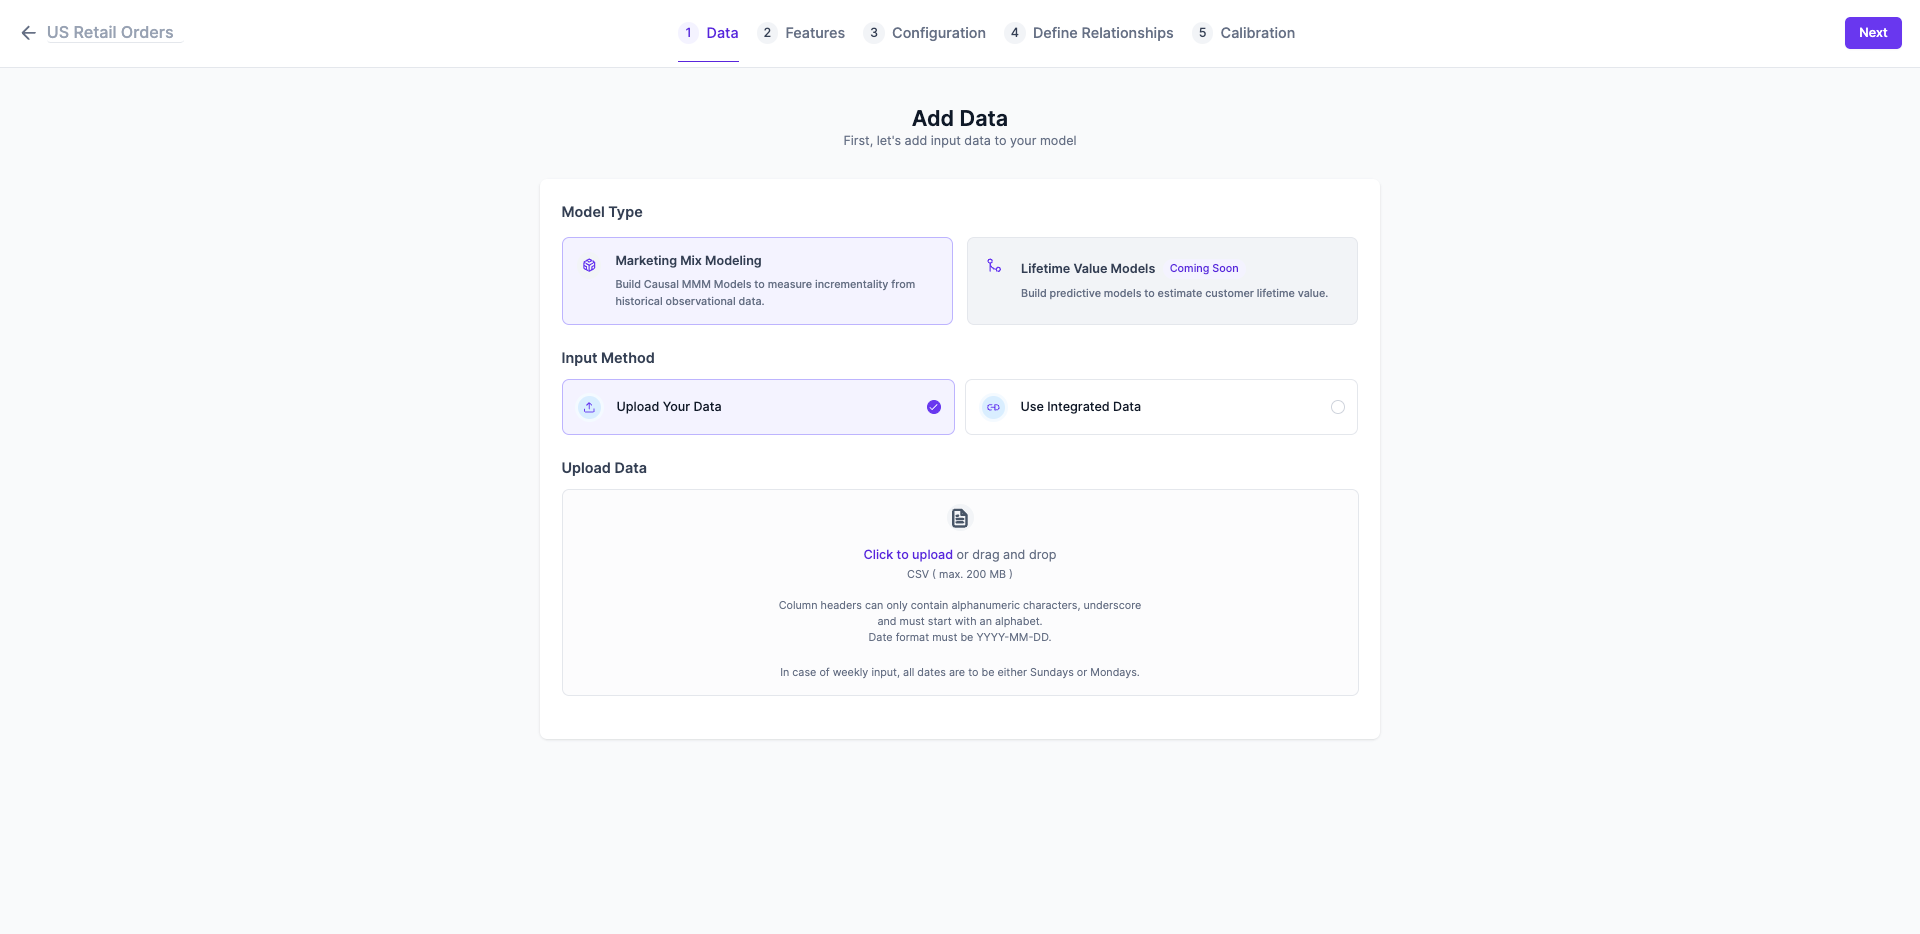
- Navigate to the MMM page by selecting Measure > Models.
- Click the
Create Modelbutton. - Enter a unique and descriptive name for your model in the top-left section.
- In the upload section, choose your data source:
- Select Using Integrated data if you have configured the Google Sheets integration.
- Select Upload a file to drag-and-drop or browse for your prepared CSV file.
- Click
Next.
Step 2: Map Data Features
In this step, you will map the columns from your dataset with the required data fields. This is critical for ensuring the model interprets your data correctly.
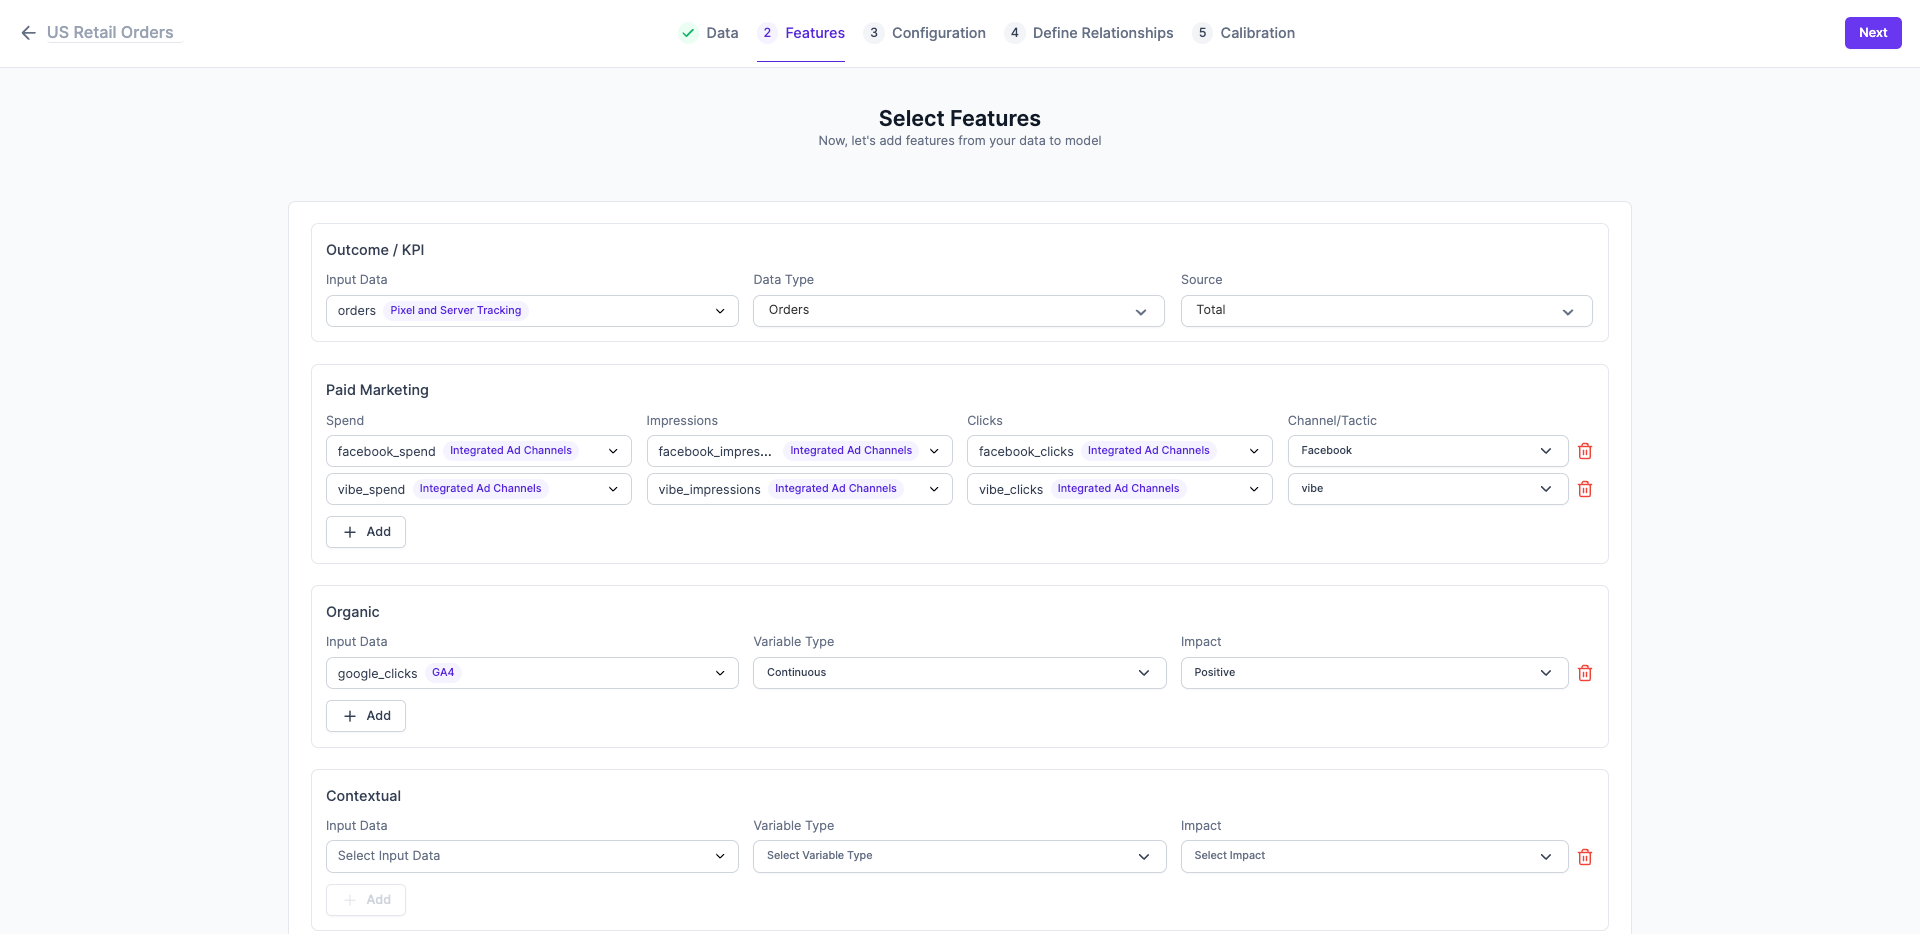
- Outcome KPI: Select the primary metric you want to measure, such as
revenue,orders, ornew_customers. This is your model's dependent variable. - Paid Marketing Variables: Map the spend, impressions, clicks, fields from the input data source to the channel/tactic names for each paid media channel. (e.g.,
Facebook_Spend,Google Search_Spend) - Organic Variables: For non-paid channels like
SEO_SessionsorDirect_Traffic, map the variable and define its expected Impact (Positive, Negative, or Neutral) on your outcome KPI. - Contextual Variables: For external factors like
Competitor_PromotionsorHoliday_Sales, map the variable and define its Impact.
What Impact Should I Choose?
- Positive: Select this if the variable is expected to increase your Outcome KPI. Example: Your own brand's promotional events.
- Negative: Select this if the variable is expected to decrease your Outcome KPI. Example: A major competitor's promotional campaign.
- Neutral: Select this if you are unsure or want the model to determine the effect without guidance.
Step 3: Configure Model Settings
Here, you will set the core parameters for your model's analysis.
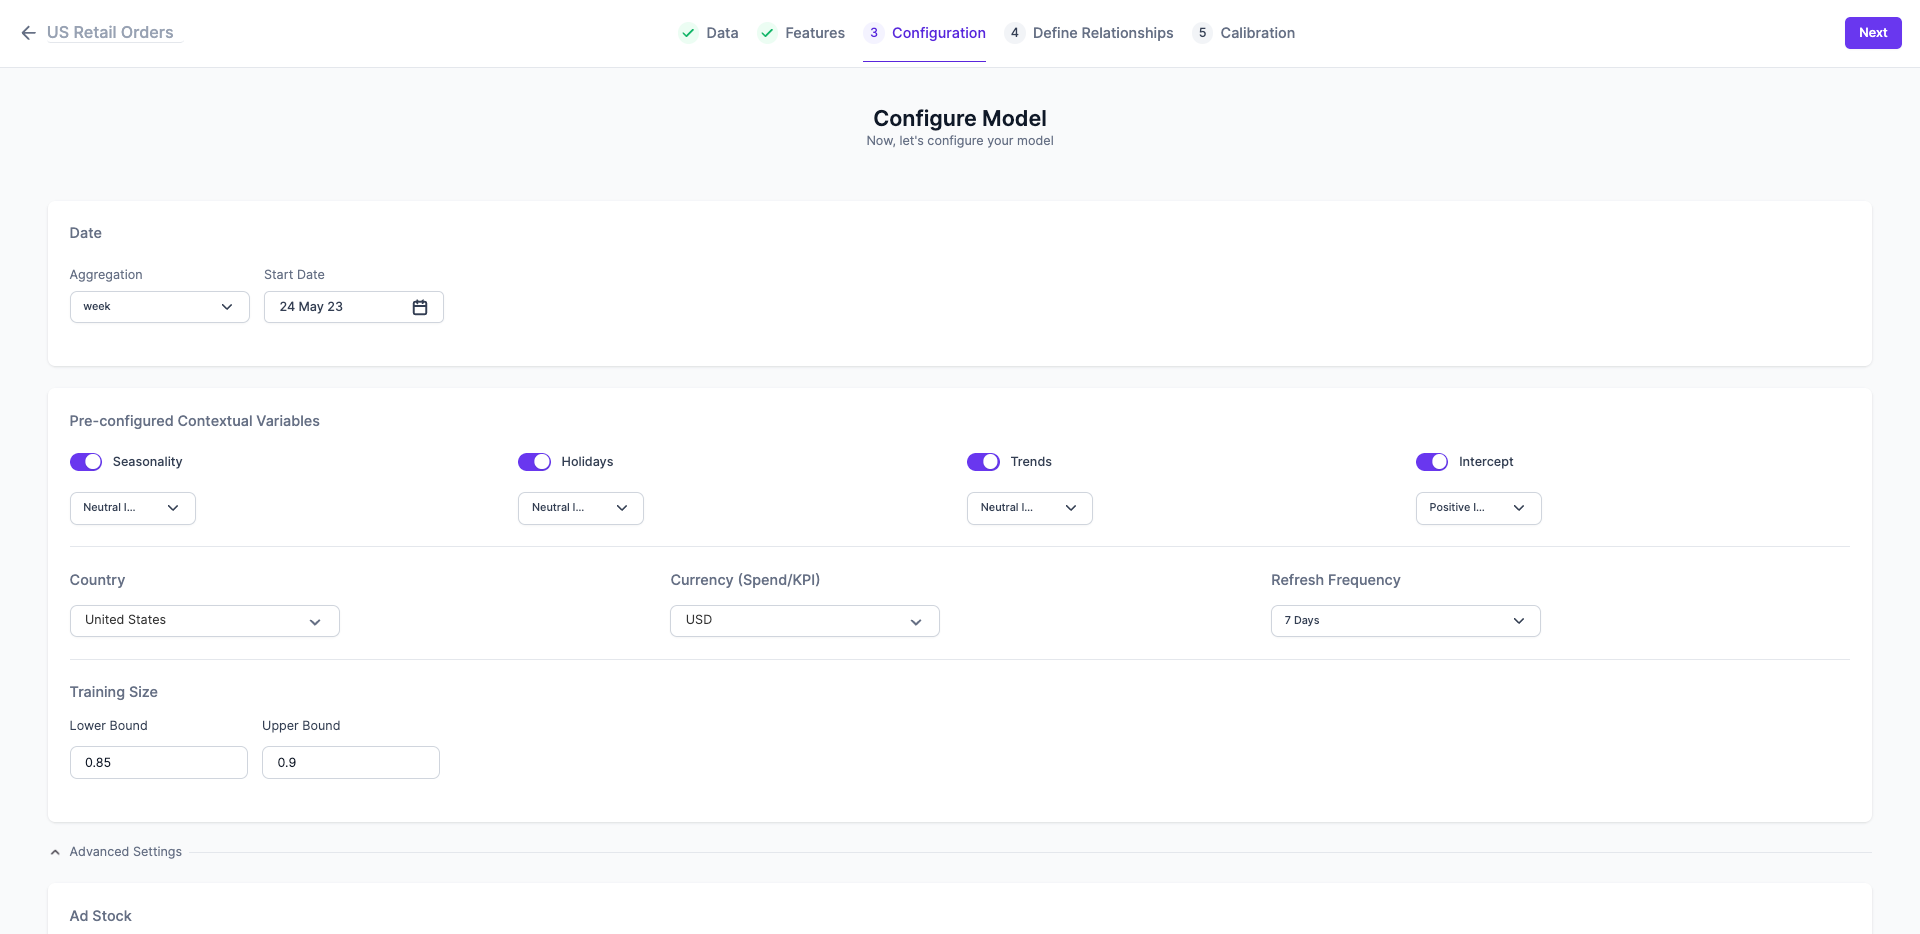
- Aggregation: Select Daily, Weekly, or Monthly to match the aggregation of your input data.
- Date Range: Confirm the start and end dates for the model's analysis.
- Pre-configured Variables: Enable or disable contextual factors like Seasonality, Weekdays, Holidays, and Trends. It is highly recommended to keep these enabled to improve model accuracy.
- Country & Currency: Select your primary country of operation and reporting currency. Selecting a country helps the model automatically account for national holidays.
- Refresh Frequency: Choose how often you want your model to be updated with new data.
- Training Size: Specify the fraction of data to be used for training (e.g., 0.85 for utilizing 85% of the entire input data set). The remaining data will be used for validation to test the model's accuracy.
Step 4: Apply Advanced Settings
This section allows data scientists and advanced users to fine-tune the model's underlying parameters.
Adstock and Saturation
For each marketing channel, you can modify its Adstock and Saturation settings.
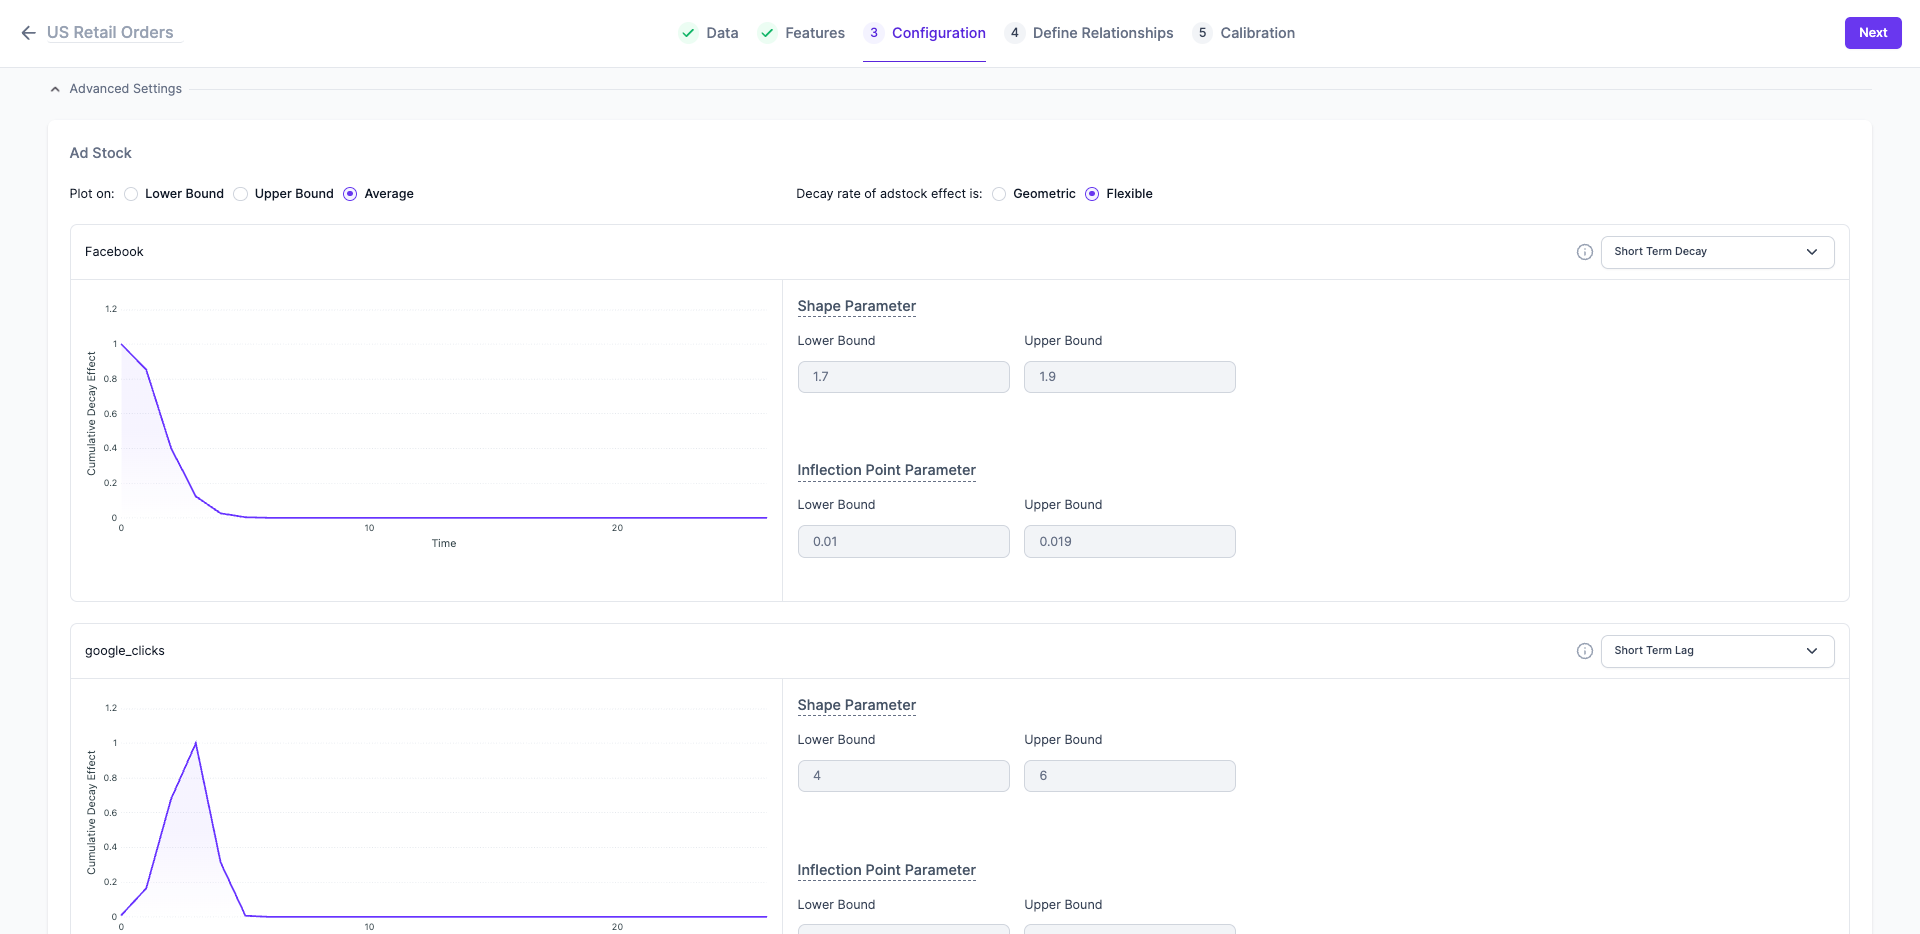
- Adstock: This accounts for the delayed or carryover effect of advertising. You can choose between two transformation methods:
- Geometric: A simple decay model.
- Flexible (Weibull PDF): A more versatile method that can model more complex decay patterns. We recommend using Flexible.
- Saturation: This models the point of diminishing returns, where additional spend on a channel stops yielding proportional increases in your KPI.
Step 5: Define Relationships
This step is for establishing the causal links between all your input variables (causes) and your outcome KPI (effect). The relationships you define here guide the model in understanding how different factors influence each other and the final result.
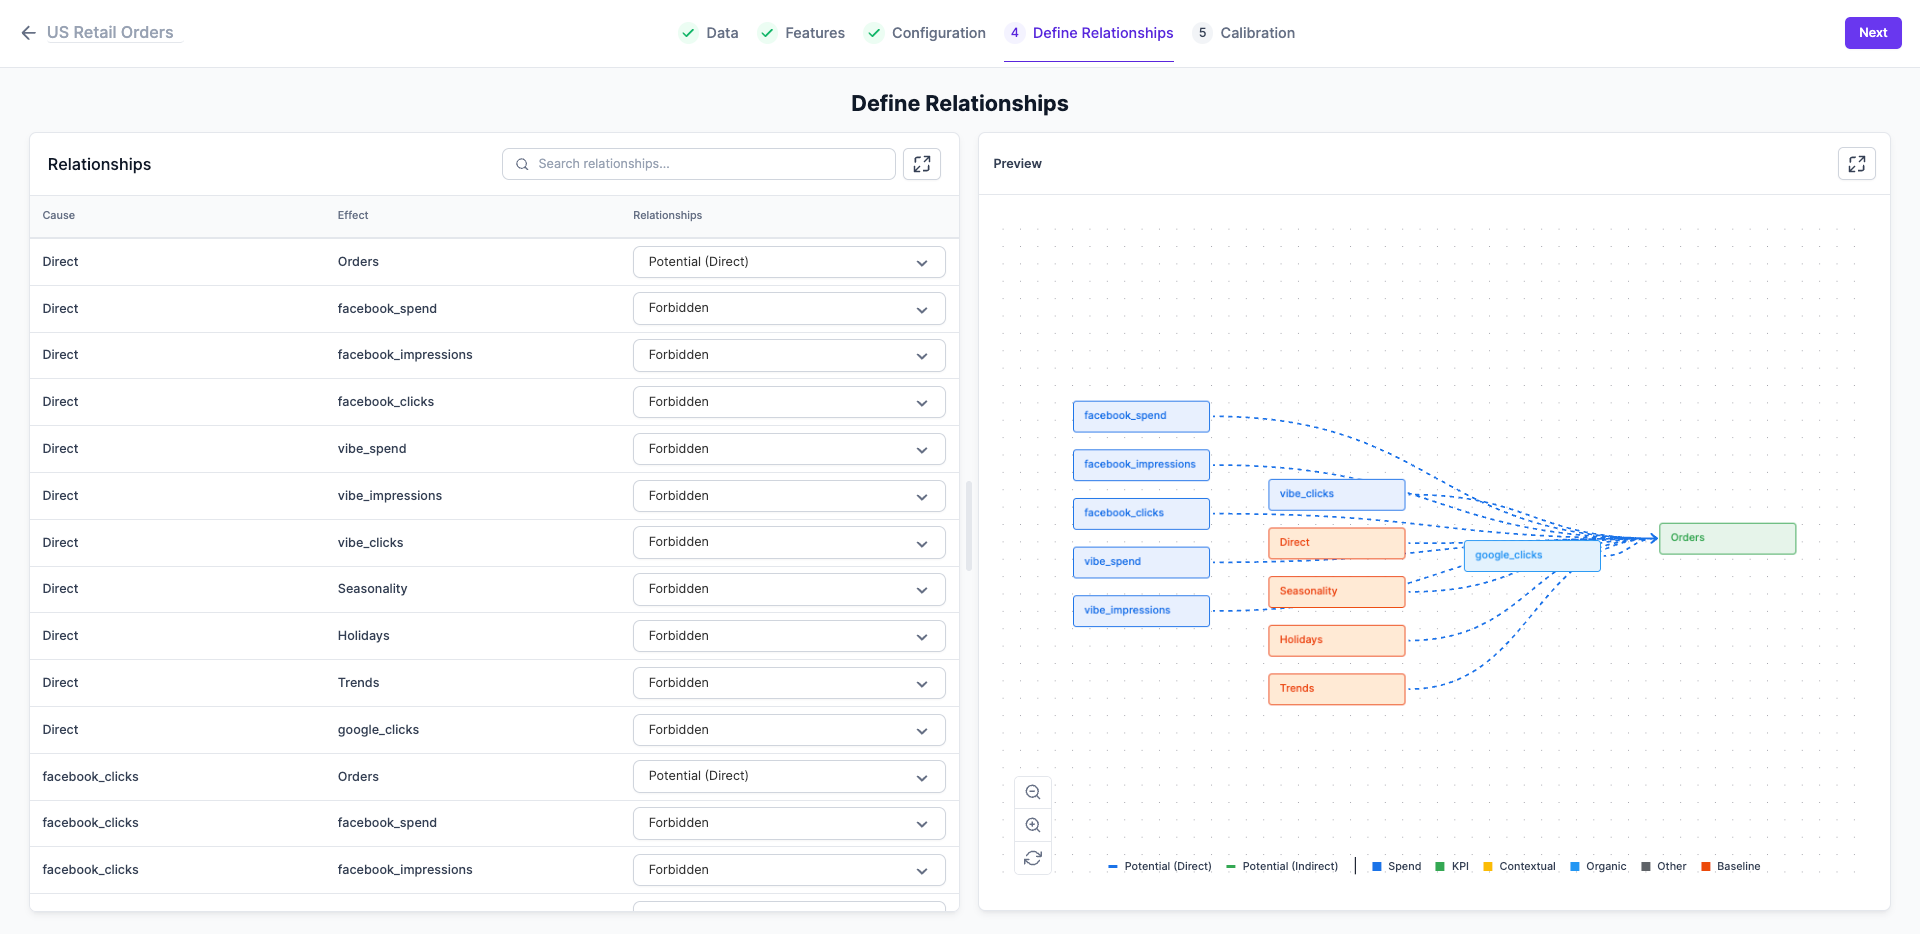
On this screen, you will see two main sections: the Relationships table on the left and a visual Preview map on the right.
-
Review the Relationship Pairs: In the table on the left, review each row, which represents a potential relationship between a Cause variable (like
facebook_spend) and an Effect variable (likeOrders). -
Select a Relationship Type: For each pair, choose one of the three relationship types from the dropdown menu:
- Potential (Direct): Select this if you believe the Cause variable directly influences the Effect variable. For example, the relationship between
Directtraffic andOrdersis set as a direct one. - Potential (Indirect): Select this if the Cause is likely to influence the Effect through an intermediate variable.
- Forbidden: This is the default for most pairs and indicates that there is no direct causal link between the two variables. For example,
Directtraffic does not causefacebook_spend, so their relationship is forbidden.
- Potential (Direct): Select this if you believe the Cause variable directly influences the Effect variable. For example, the relationship between
-
Use the Visual Preview: The graph on the right provides a real-time visualization of the relationships you are defining. Use this map to confirm that the connections and pathways make logical sense. The nodes are color-coded, and the arrows show the direction of influence.
-
Proceed to the Next Step: Once you have reviewed and adjusted all the relationships to your satisfaction, click
Nextto proceed to the Calibration step.
Step 6: Calibrate Your Model
If you have run any recent marketing experiments (e.g., lift studies, geo-tests), you can use the results to calibrate your MMM. This process anchors the model's results to real-world observations, significantly improving its accuracy.
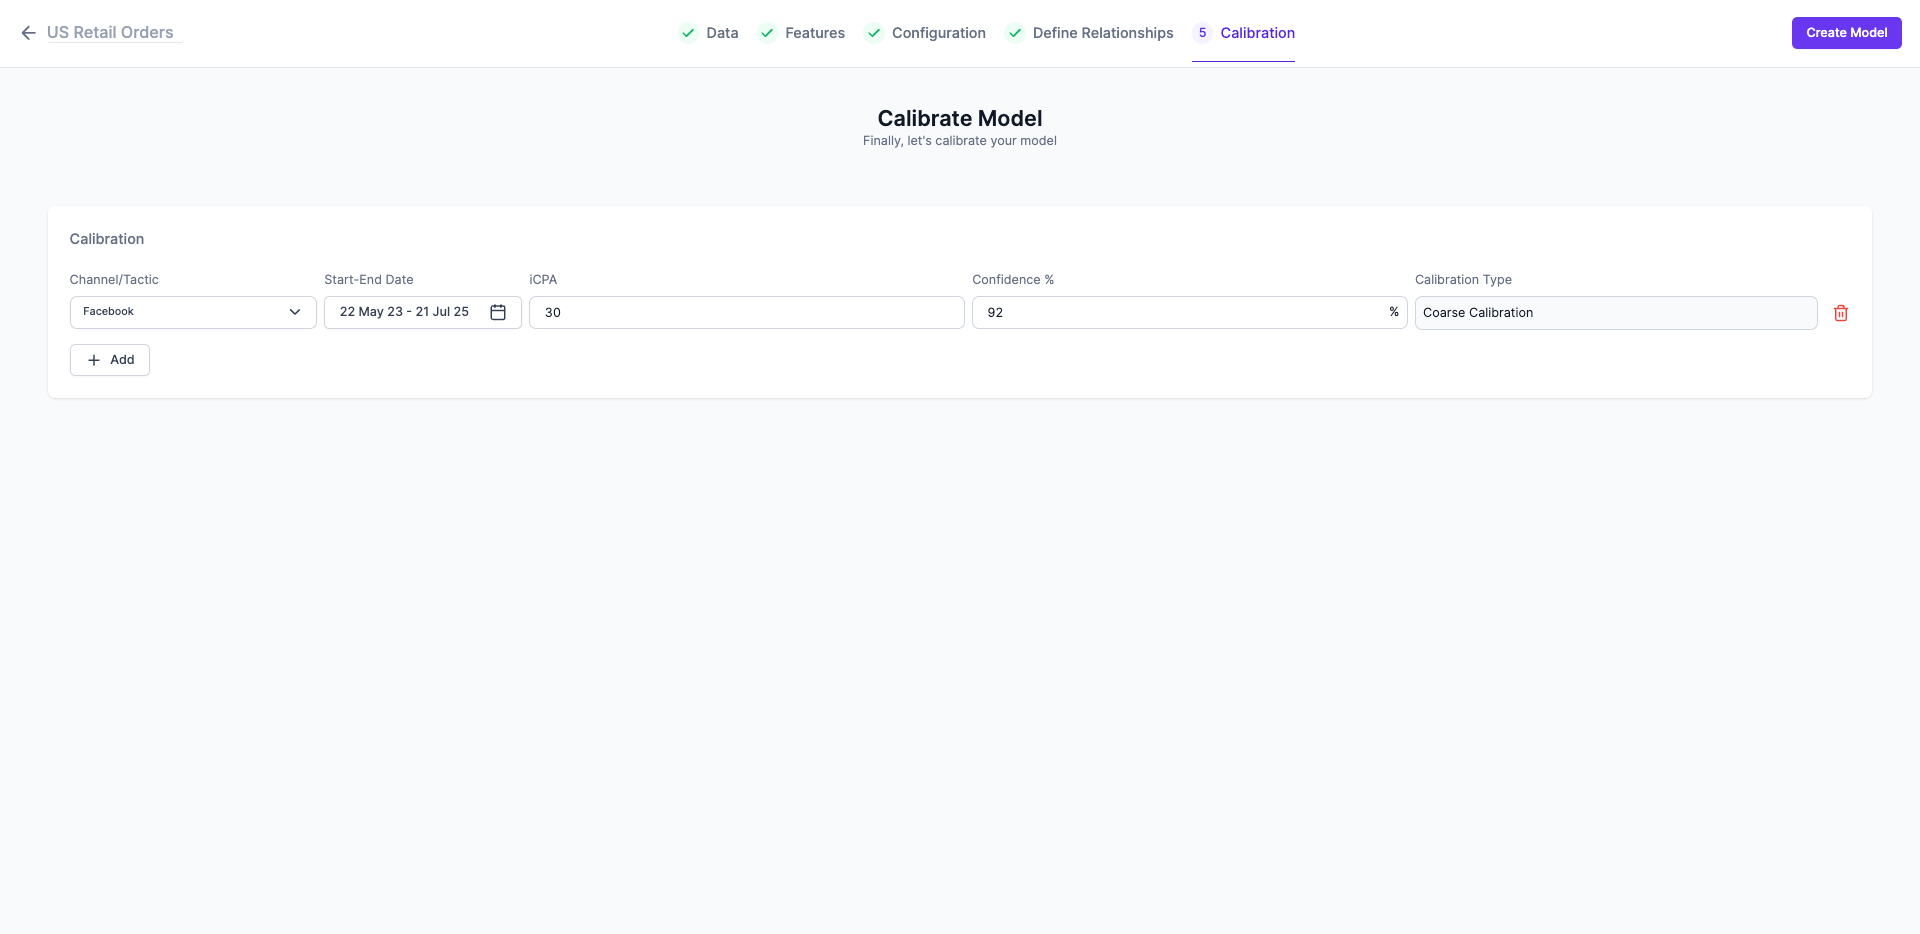
To add a calibration insight:
- Click Add Calibration
- Select the channel the experiment was run on.
- Specify the Start and End Date of the experiment.
- Enter the total Spend for that period.
- Input the observed Incremental lift and the Confidence Level of your experiment's result.
Step 7: Create and Run Your Model
Once you have reviewed your configuration:
- Click the
Create Modelbutton at the bottom of the page. - The model's status will change to "In progress". You will be notified once the model has run successfully and the status changes to "Success".
After your model is created, you can navigate to the MMM Overview tab to uncover insights and analyze your results.
Updated 10 months ago