Geo Experiment Insights
Interpreting your Geo Test Results
Once your geo-distributed experiment has concluded, the Lifesight UMM platform provides a comprehensive results page. This guide will walk you through how to interpret the different components of this page to make confident, data-driven marketing decisions.
Navigating the Results Page
The results for a completed experiment are split into two main views, accessible via tabs at the top of the page:
- Insights: This is the primary view for understanding the outcome and statistical validity of your test.
- Test Design: This tab shows the original configuration of the experiment, which is crucial for contextualizing the results.
The 'Test Design' Tab
Understanding the experiment's setup is crucial for interpreting the results correctly. This tab provides a complete summary of the experiment's configuration.
Experiment Configuration
This section shows the high-level parameters you defined when creating the test.
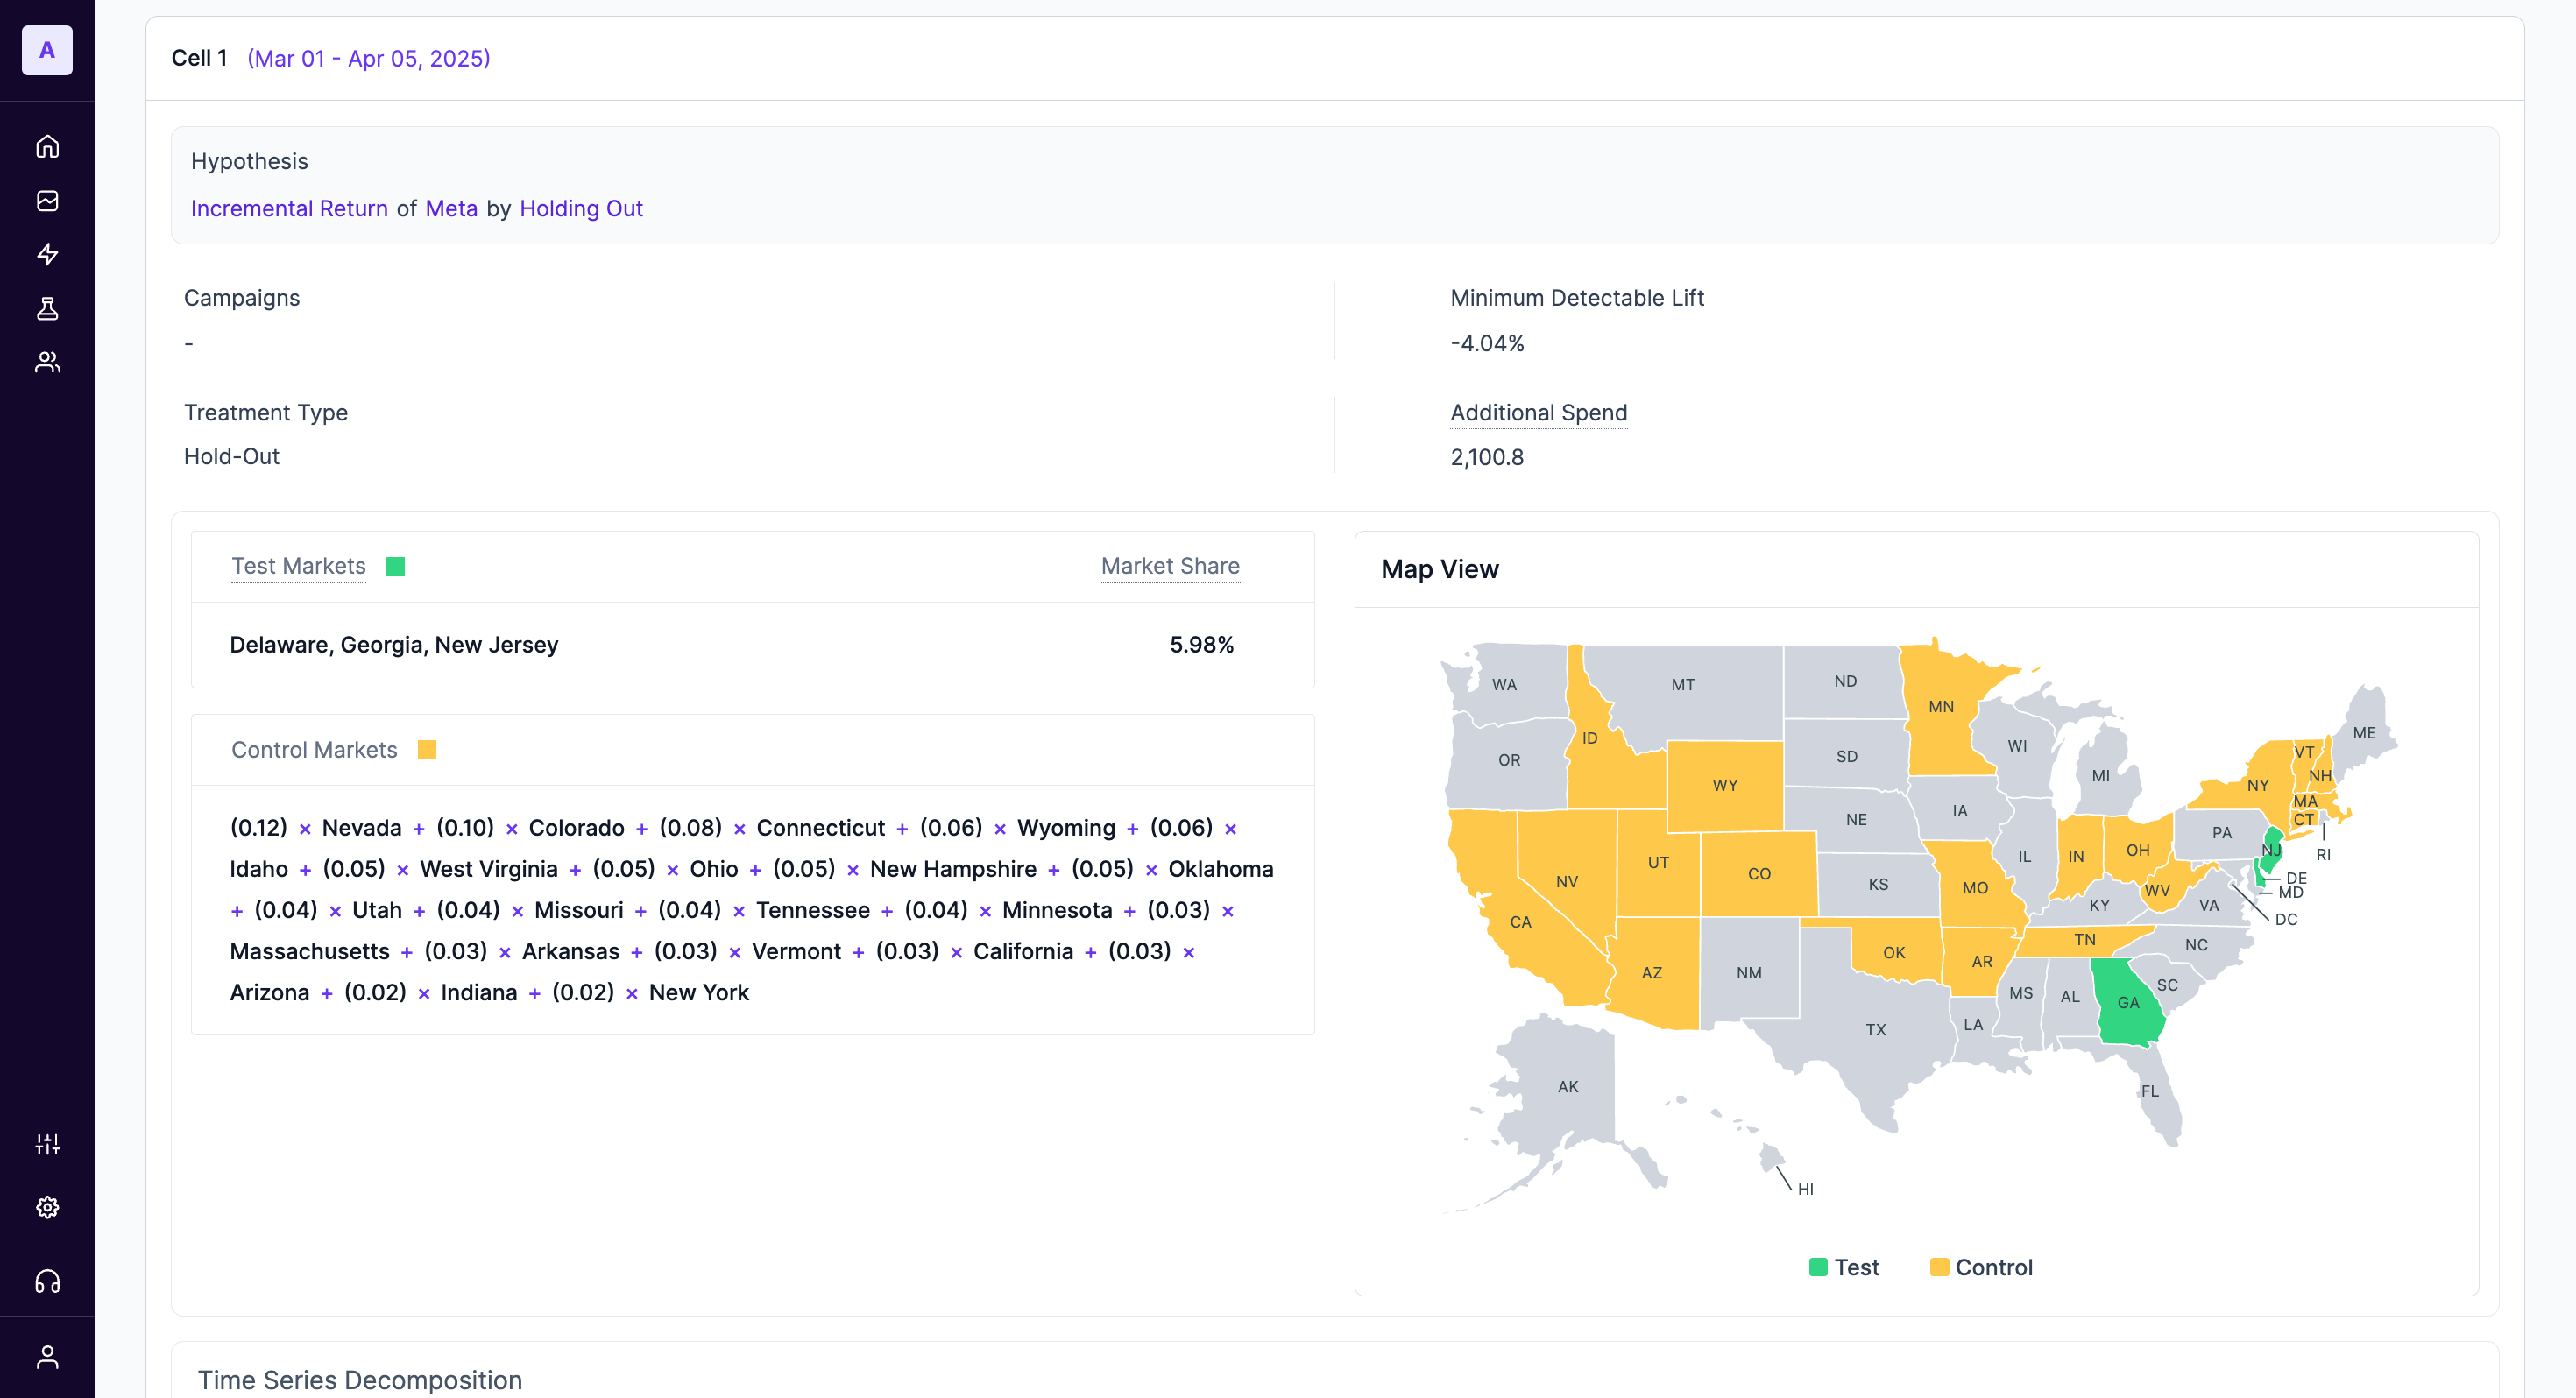
- Hypothesis: The original question you set out to answer (e.g., "Incremental Return of Meta by Holding Out").
- Treatment Type: The kind of test run (e.g., Hold-Out, Scale-Up).
- Minimum Detectable Lift (MDL): The smallest effect size the experiment was designed to reliably detect.
- Test & Control Markets: The specific geo-locations assigned to each group.
Advanced Charts
The Test Design tab also includes powerful visualizations for advanced analysis.
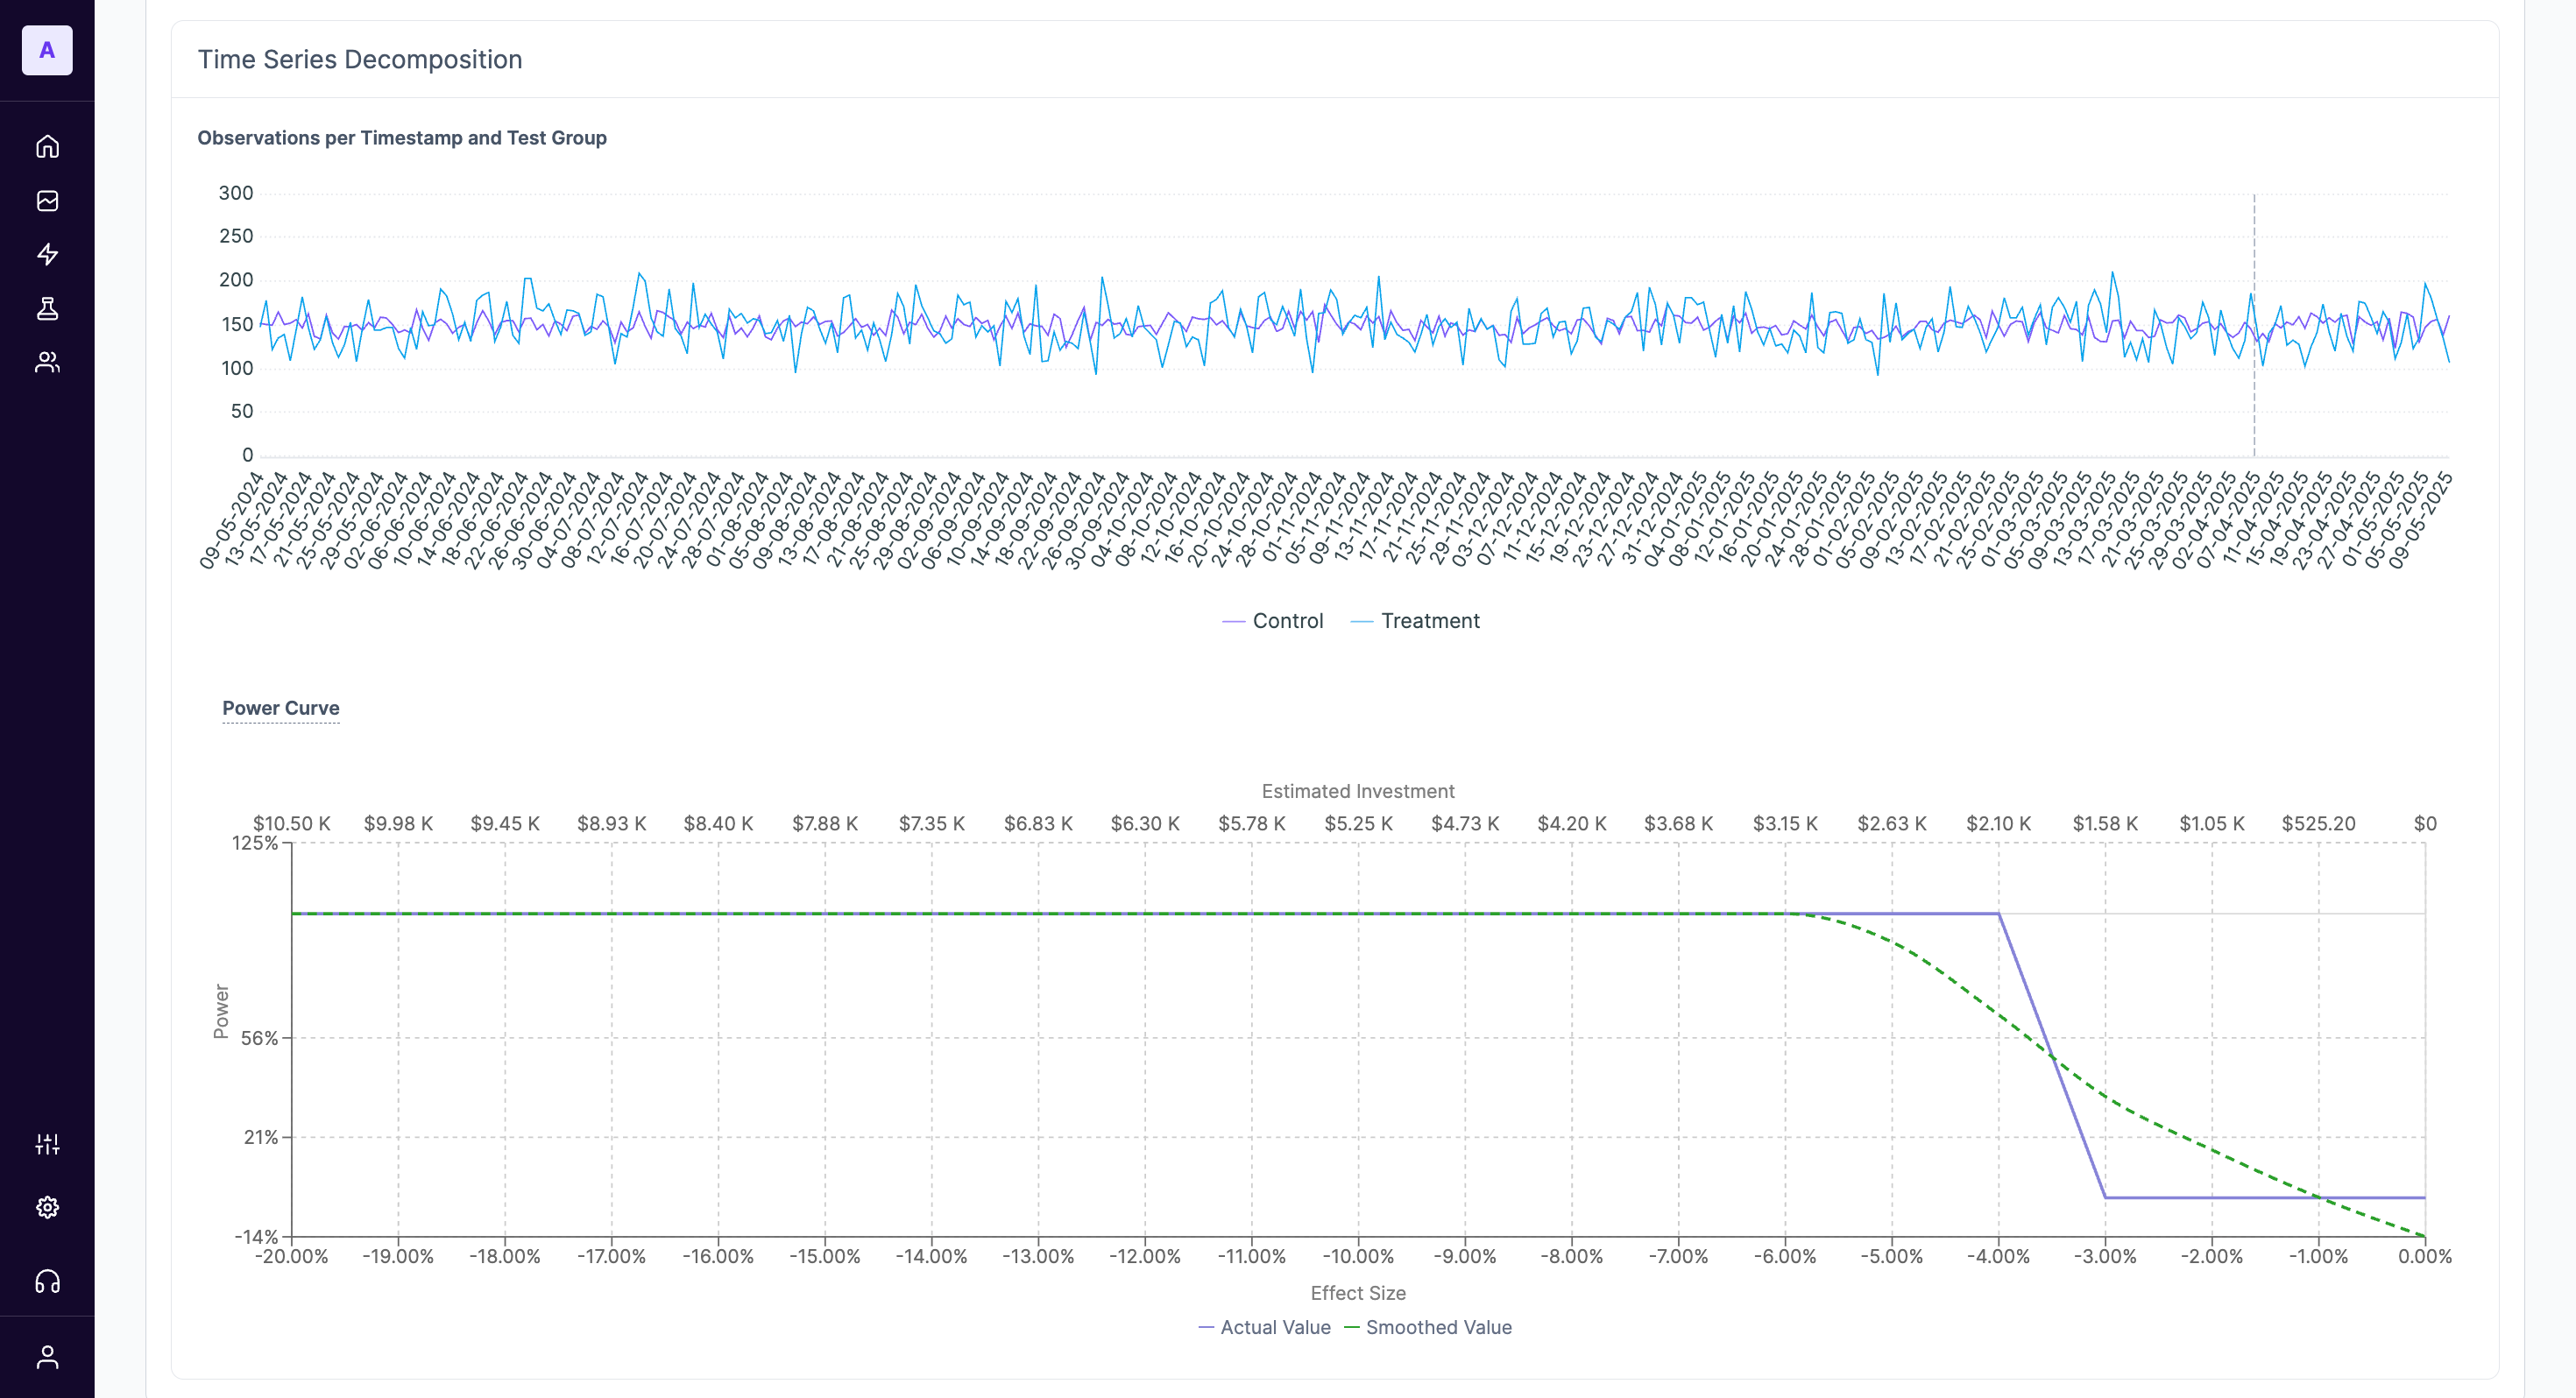
- Time Series Decomposition: This chart shows the raw daily observations for the primary metric across both test and control groups, including the pre-test period. It's useful for verifying that the two groups were behaving similarly before the test began.
- Power Curve: This chart illustrates the statistical power of your experiment.
How to Read the Power Curve
The power curve shows the probability (Y-axis) of detecting a true effect of a certain size (X-axis) at your given investment level. A steep curve is ideal. It helps you answer questions like, "If the true effect of my media was a 5% lift, what was the chance this test would have detected it?" This is essential for understanding why a test might have been inconclusive.
The 'Insights' Tab
The Insights tab is designed to give you a clear, immediate understanding of your experiment's performance.
Summary Cards
At the top of the page, you'll find summary cards for each test cell. In a typical hold-out experiment, this will show results for the Treatment group (where a change was made, e.g., media was held out) and the Control group (where business continued as usual).
Each card breaks down the following key metrics observed during the test period:
- Market: The group of geo-locations included in this cell.
- Spend: The total media spend allocated to this cell during the experiment.
- Installs: The total number of the primary conversion metric (e.g., installs, sign-ups, sales) attributed to this cell.
Difference Analysis & Statistical Validity
This section quantifies the impact of your test and tells you whether the result is statistically meaningful.
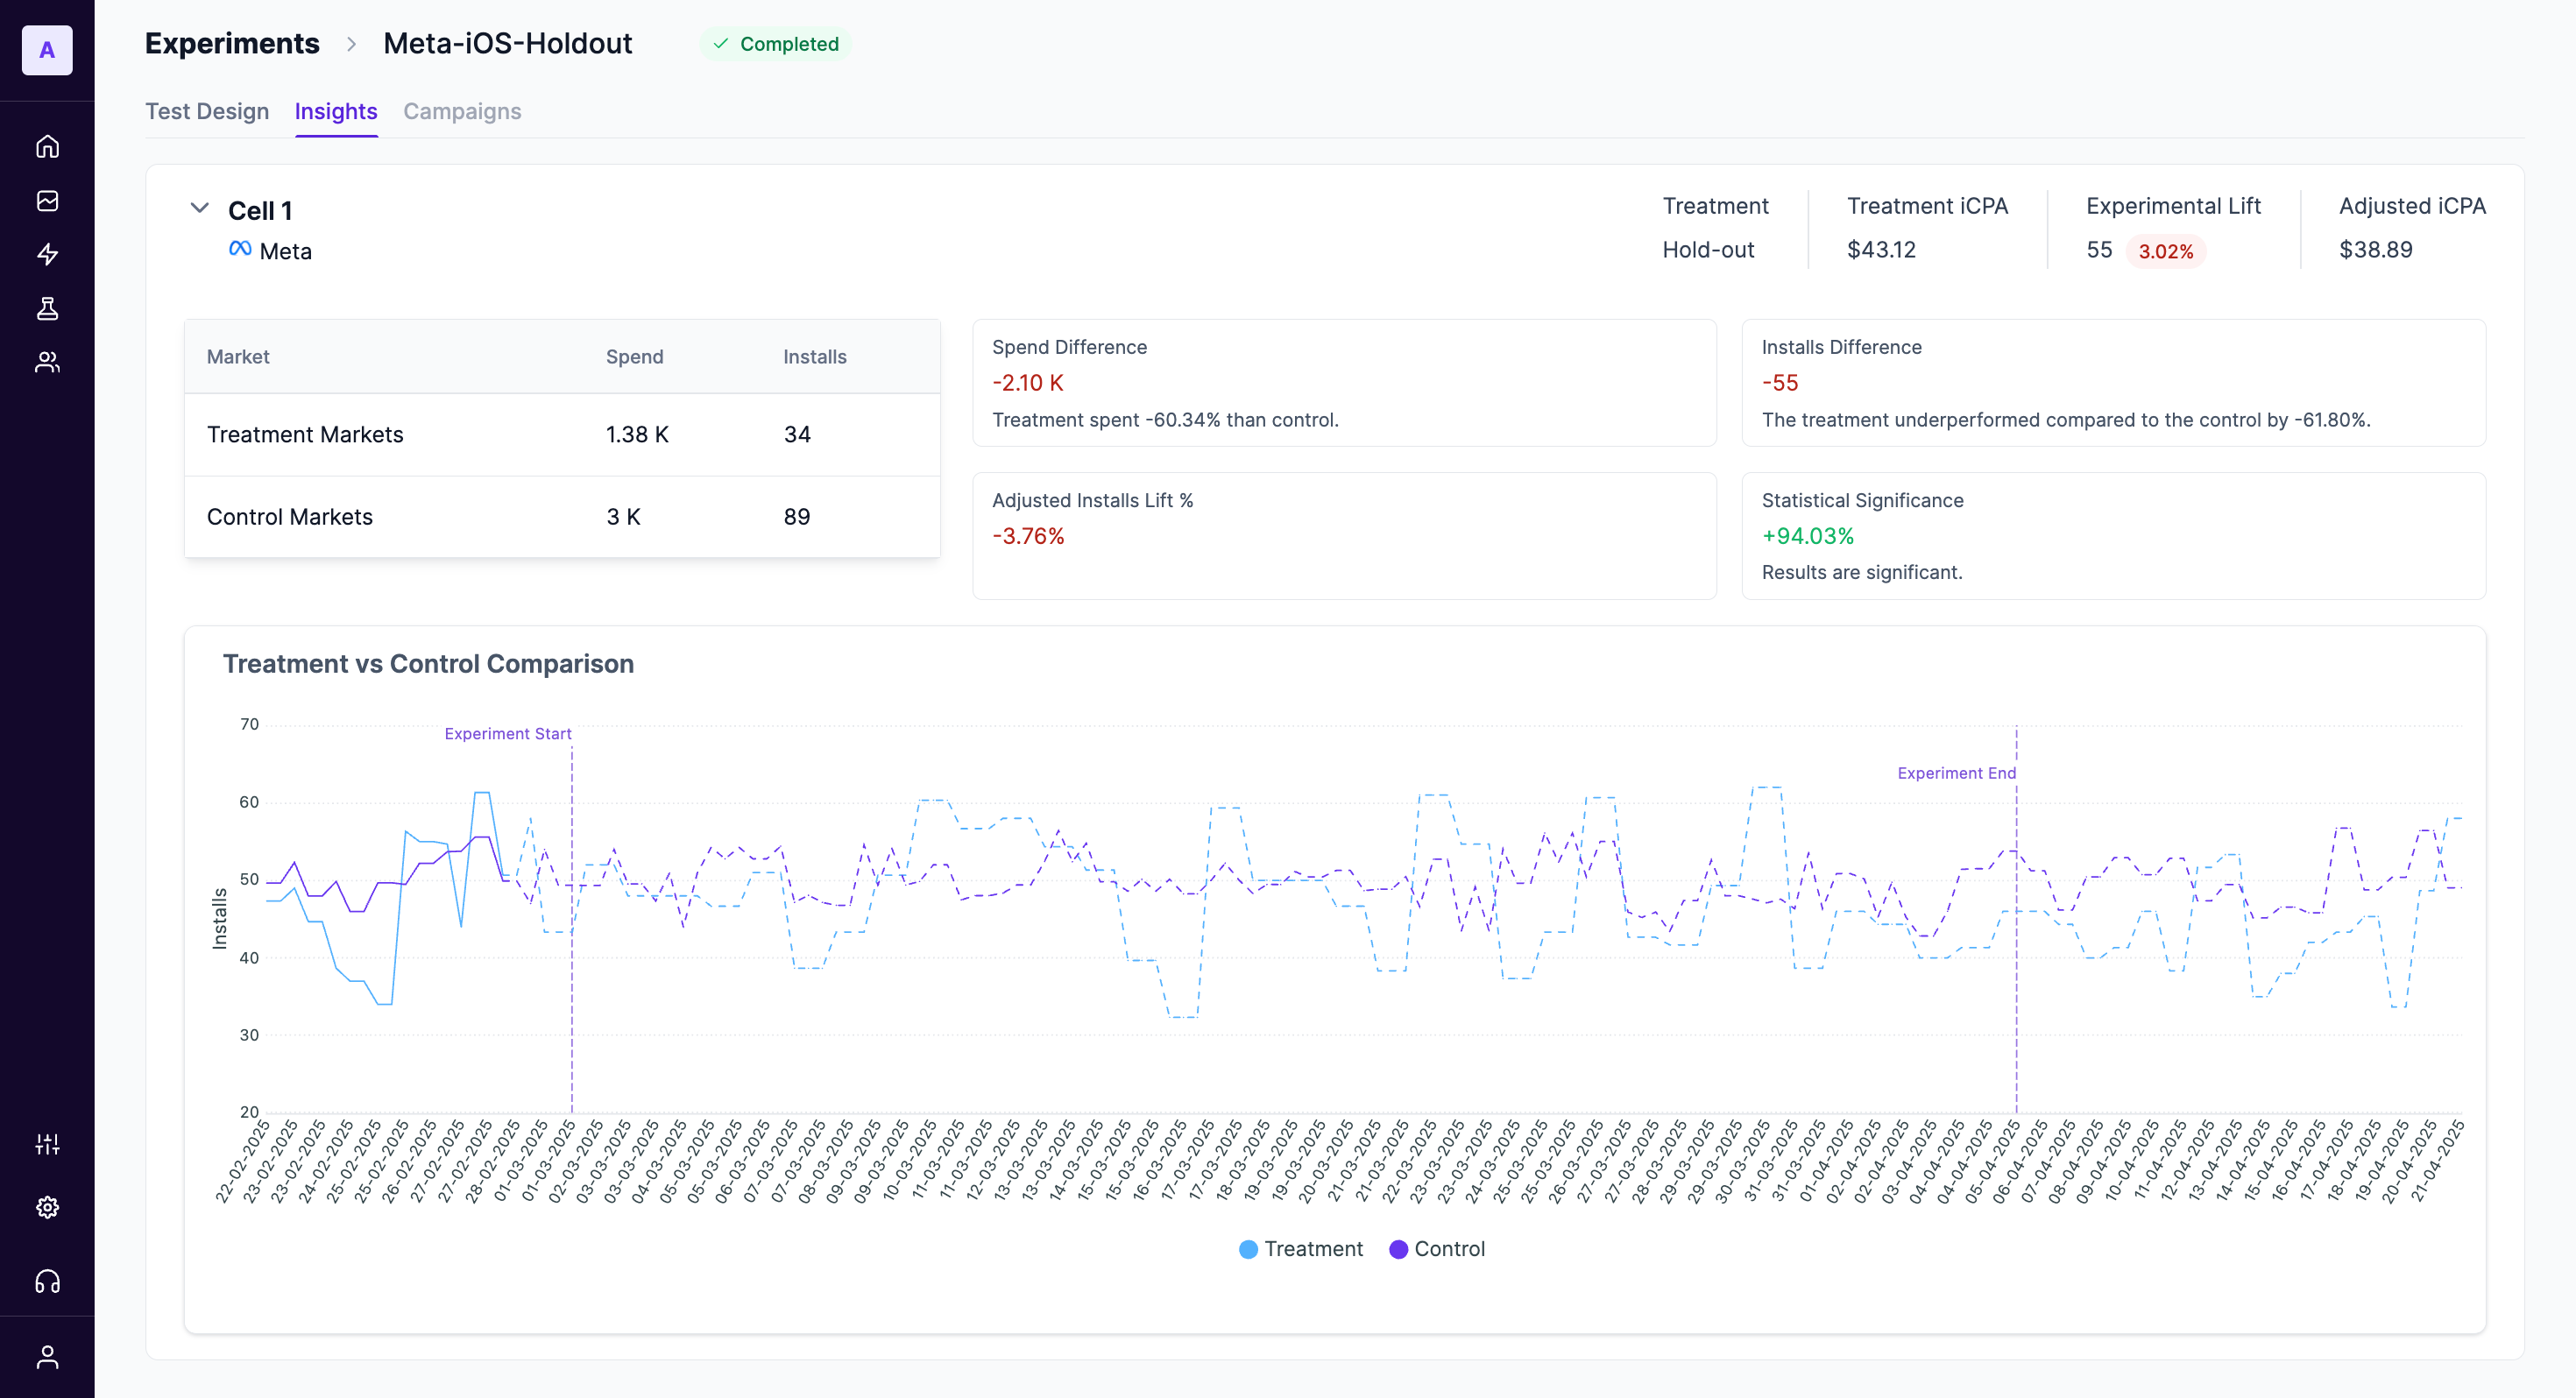
- Spend/Installs Difference: Shows the raw difference in spend and conversions between the treatment and control groups.
- Adjusted Installs Lift %: This is the core result of your experiment. It represents the percentage increase or decrease in your primary metric in the treatment group compared to the control group, after accounting for pre-test differences and other model adjustments. A negative lift in a hold-out test indicates that the marketing activity was effective.
- Statistical Significance: This percentage tells you how likely it is that the observed lift is a real effect and not due to random chance.
What is Statistical Significance?
A significance level of 90% or higher is generally considered strong. For example, a significance of 94.03% means there is a 94.03% probability that the measured lift is a real effect caused by your changes. You can be confident in making a decision based on this result.
- Treatment / Control iCPA: The incremental Cost Per Action for each group. This helps you understand the efficiency of your spend.
- Experimental Lift: The raw, unadjusted lift in your primary metric.
- Adjusted iCPA: The final, model-adjusted cost per action for the treatment group. This is a key efficiency metric to judge the financial impact of your strategy.
Treatment vs Control Comparison Chart
This time-series graph plots your primary metric (e.g., Installs) for both the Treatment and Control groups over the duration of the experiment.
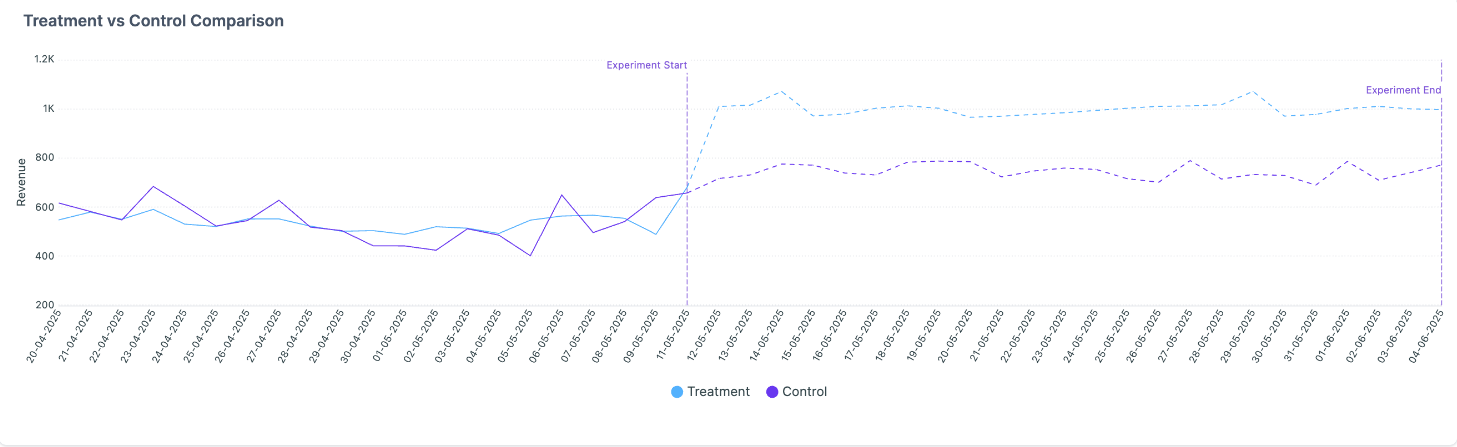
Use this chart to visually inspect performance trends. Look for:
- Divergence: A clear and sustained gap between the treatment and control lines after the experiment starts.
- Anomalies: Any sudden, unexpected spikes or dips that might correspond to external events not captured in the model.
How to Read the Power Curve
The power curve shows the probability (Y-axis) of detecting a true effect of a certain size (X-axis) at your given investment level. A steep curve is ideal. It helps you answer questions like, "If the true effect of my media was a 5% lift, what was the chance this test would have detected it?" This is essential for understanding why a test might have been inconclusive.
Drawing Actionable Conclusions
To make a final decision, synthesize the information from all sections:
- Check the Lift: Look at the Adjusted Lift %. Is it positive or negative? Is the magnitude meaningful for your business?
- Verify Significance: Look at the Statistical Significance. Is it above 90%? If so, you can trust the lift amount. If not, the result is inconclusive, and you cannot confidently say the test had any effect.
- Review Efficiency: Look at the Adjusted iCPA. Has your marketing efficiency improved or worsened?
- Contextualize with Test Design: Revisit the MDL. If the observed lift is smaller than the MDL, it's not surprising if the significance is low.
Example Conclusion:
If a hold-out test results in a**-3.76% adjusted lift** with94% significance and an Adjusted iCPA of $38.88, the conclusion is clear: the media spend that was held out was driving a significant number of conversions. The marketing activity is effective, and the recommendation would be to continue (or even increase) this investment.*
Updated 12 months ago