Attribution chart
Leverage a powerful Attribution chart to uncover hidden patterns and opportunities in your data.
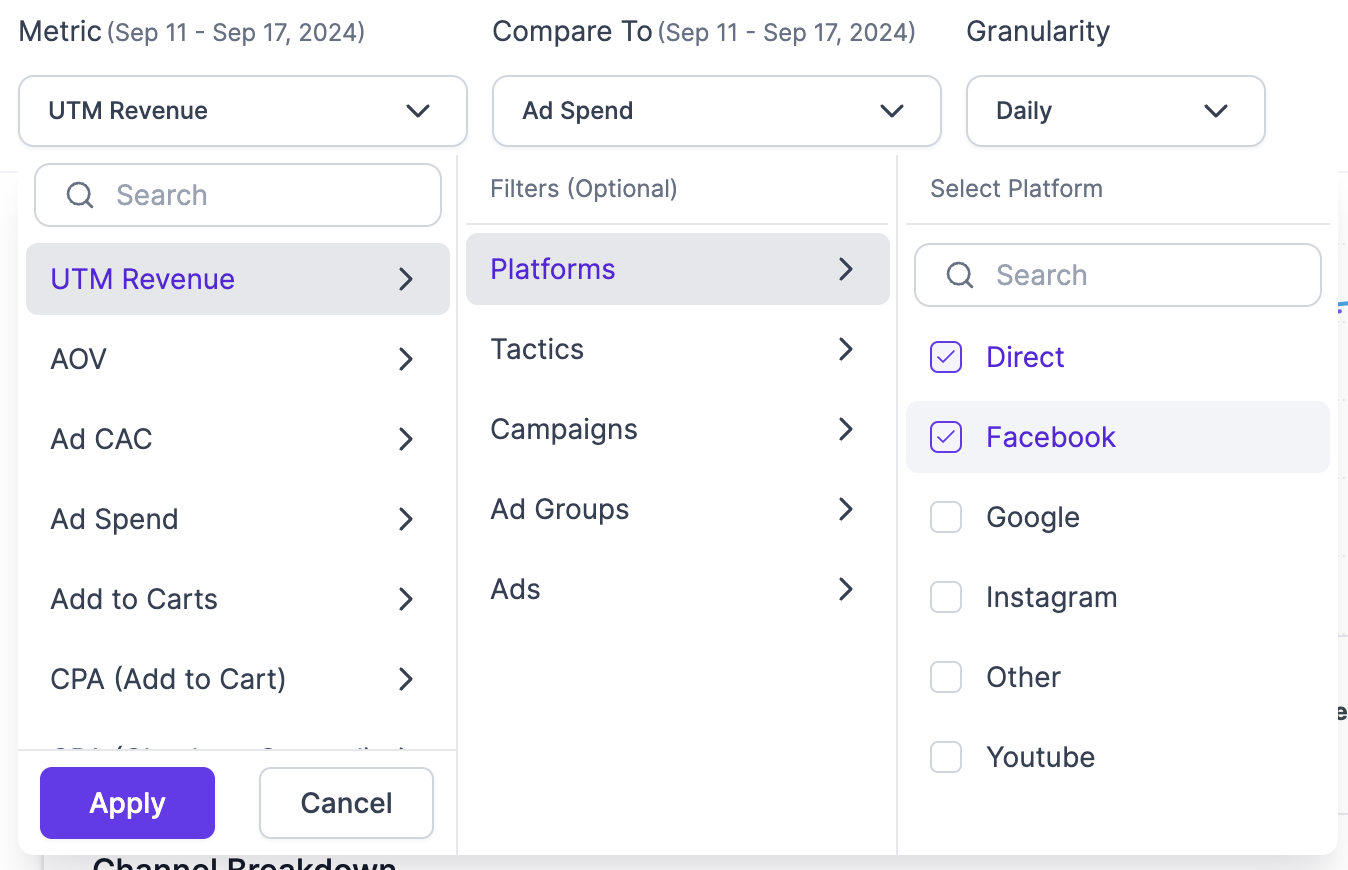
Metrics
This dropdown field lets users, choose any Attribution metric across any of these filters:
- Platform - Choose from a list of connected Attribution channels to display your selected metric.
- Tactic - Select any tactic from a list of connected Attribution channels to display your selected tactics.
- Campaign - Choose any 1 or multiple campaigns from all your connected Attribution channels to view your selected metric
- Ad Groups - Select 1 or multiple ad groups from all your connected Attribution channels to view your selected metric
- Ads - Choose any 1 or multiple ads from all your connected Attribution channels to view your selected metric
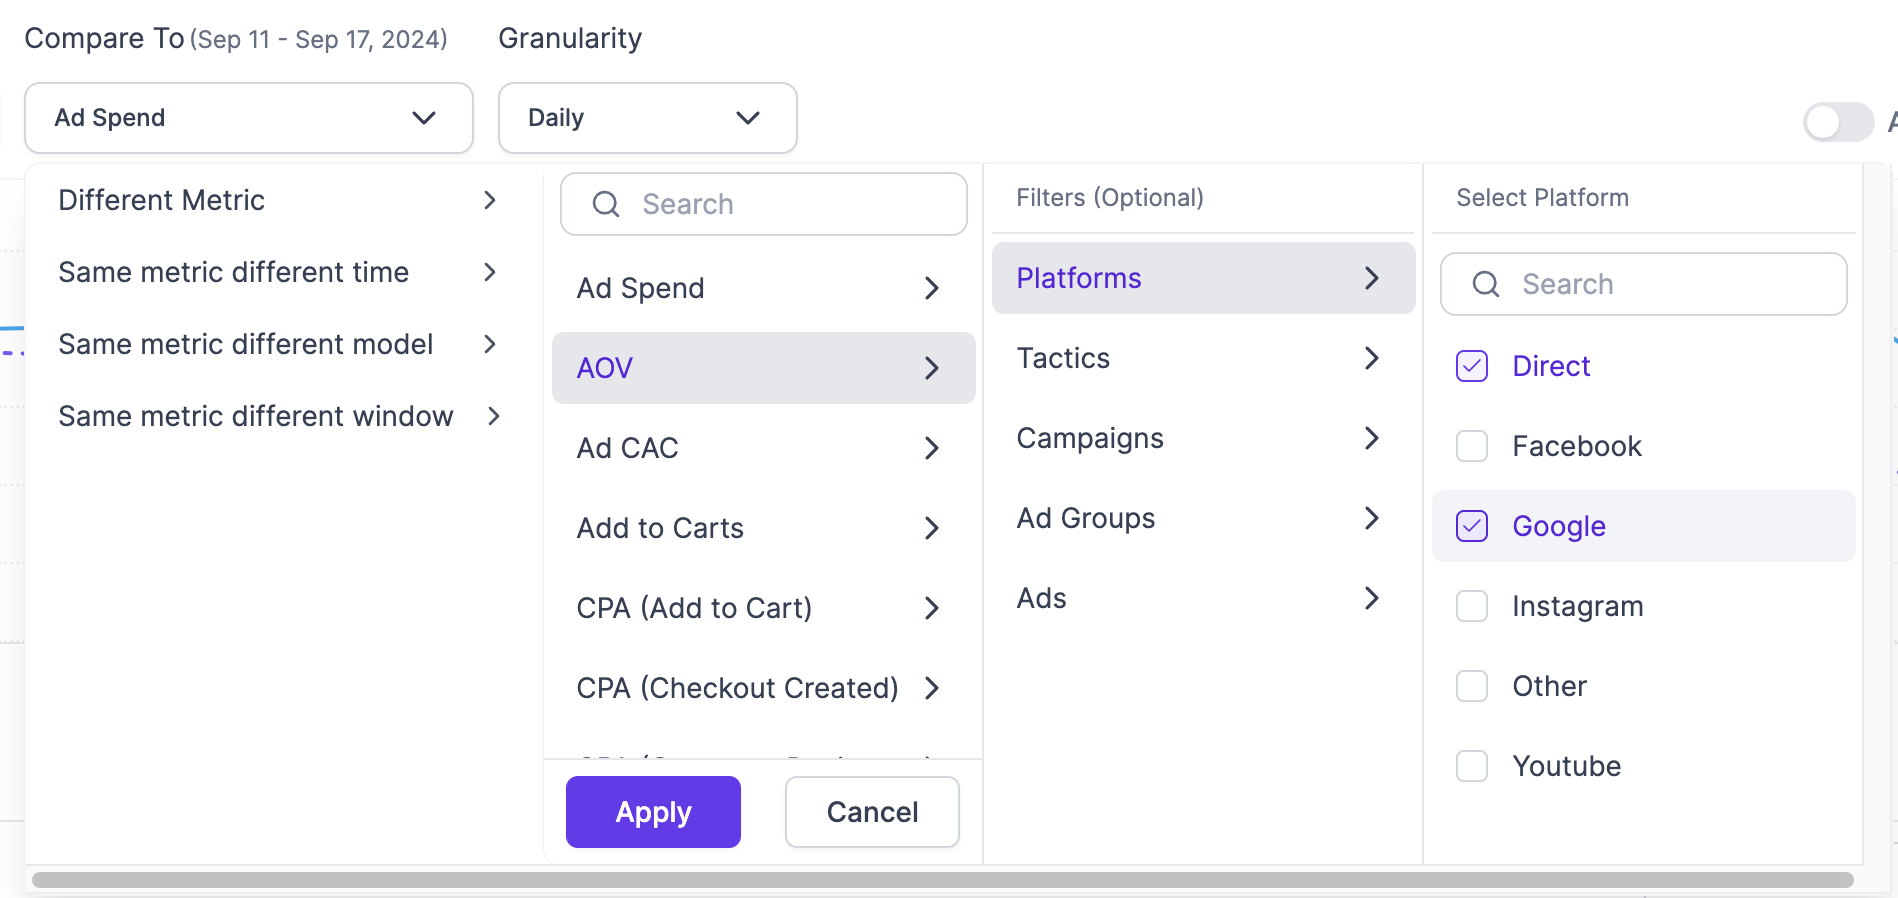
Compare to
Users can choose any metric, time period, attribution model or attribution window to compare to.
- Different metric - Choose any other metric like Revenue or NC Revenue across any channel or sub-campaign granularity from across your connected Attribution channels.
- Same metric different time - Choose a different time period, either previous period or same period from a different year to compare.
- Same metric different model - Select another Attribution model (Last Touch, Algorithmic, etc) to compare metrics.
- Same metric different window - Select a different Attribution window to compare a metric against.
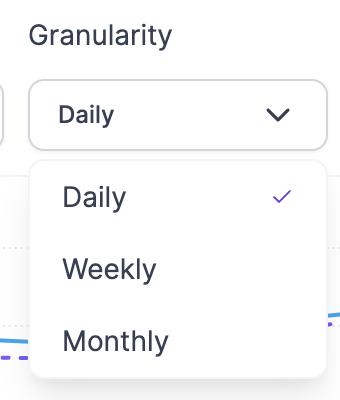
Granularity:
Plot your metrics on a daily, weekly or monthly basis based on your preference.
Additional options
- Align axis - Align chart axes for accurate, scale-to-scale comparisons, ensuring more precise and meaningful data analysis.
- Line/Bar graph - Easily switch between line and bar charts for a fresh perspective on your data, helping you quickly spot trends and insights.
- Export - Export your charts and data in formats like PNG, JPG, PDF, SVG, CSV, and XLSX for seamless integration into presentations and reports.

Updated over 1 year ago
Did this page help you?