Transformation - Saturation
Understanding diminshing returns in Marketing Mix Modeling
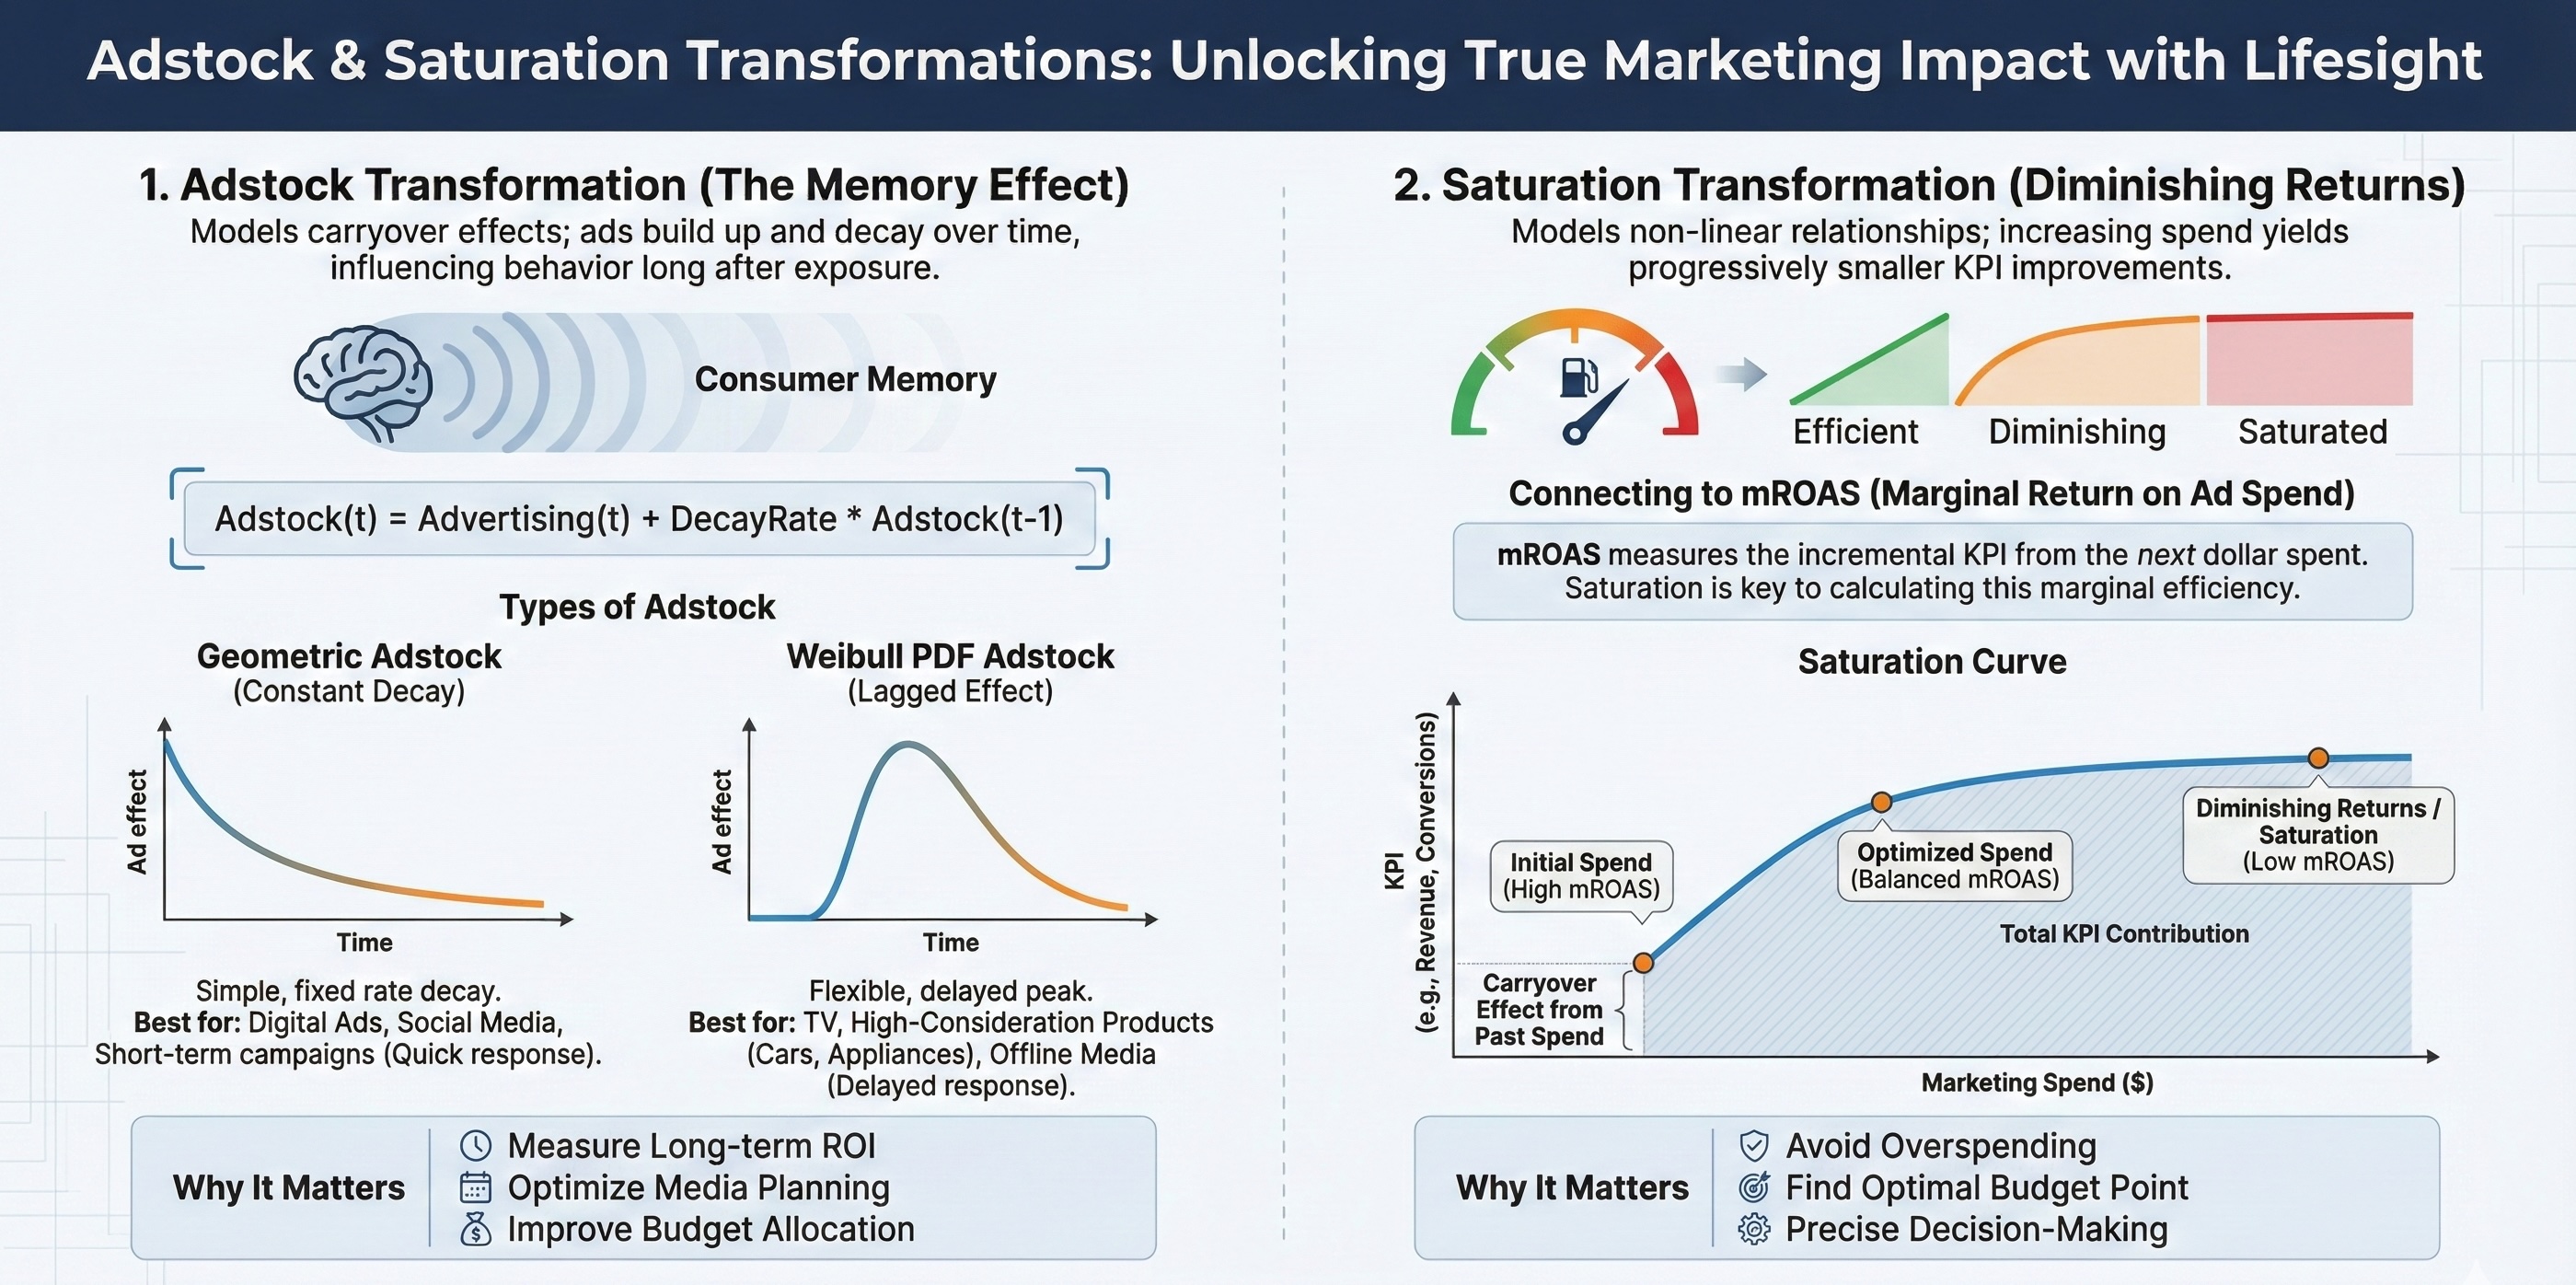
In the previous section we learned about the need of non-linear transformations in general and adstock transformations in particular.
At Lifesight, we are committed to helping businesses maximize the effectiveness of their marketing investments. One of the key metrics that we use to optimize marketing campaigns is mROAS—Marginal Return on Ad Spend. Unlike traditional ROAS, which measures the overall return on all ad spend, mROAS specifically quantifies the return on the next dollar spent, allowing businesses to make more granular and optimized decisions about budget allocation.
This document will provide a detailed explanation of mROAS, how it is calculated for every channel, and how it helps in making informed, data-driven decisions for budget allocation.
What is mROAS?
Marginal ROAS (mROAS) measures the incremental KPI generated from the next unit of ad spend. It provides an understanding of the slope of the return curve at a given point, helping marketers decide where to allocate additional resources most efficiently.
Key Formula:
mROAS = (Marginal KPI) / (Marginal Spend)- Marginal KPI: The increase in the relevant KPI (e.g., revenue, conversions, installs) that comes from the next dollar (or any currency unit) spent on a particular channel.
- Marginal Spend: The incremental increase in the spend for that channel.
mROAS helps answer the question: "For the next dollar I spend, which channel will provide the highest KPI growth?"
Why Use mROAS?
While traditional ROAS gives an overall view of how efficiently a campaign is driving a KPI, mROAS allows marketers to drill down and optimize their budget by focusing on marginal efficiency. Here's why mROAS is critical in the context of marketing mix optimization:
- Optimization of Budget Allocation:
- Traditional ROAS focuses on the past performance of the entire campaign, but mROAS provides a forward-looking view. By using mROAS, Lifesight helps businesses allocate future budgets to channels that offer the best return for the next dollar spent in terms of relevant KPIs like revenue, conversions, installs, or store visits.
- Diminishing Returns & Saturation:
- Channels tend to experience diminishing returns after a certain point. With mROAS, you can understand when additional spending on a channel will yield diminishing KPI returns, enabling smarter decisions around increasing or decreasing ad spend on specific channels.
- Precise Decision-Making:
- mROAS allows for fine-tuned adjustments to your marketing mix. Instead of scaling back or increasing ad spend on entire channels based on past performance, mROAS shows you the marginal effect of small adjustments, ensuring more precise decision-making.
How is mROAS Calculated at Lifesight?
The calculation of mROAS at Lifesight is grounded in marketing mix models (MMM) and involves several critical steps to ensure that every dollar spent is optimized for maximum KPI efficiency.
1. Adstock Transformation (Lagged Effects)
The response to marketing spend is not always immediate. For each channel, we apply the adstock transformation to account for carryover effects. The adstock transformation ensures that the effect of previous campaigns is accounted for when calculating the current marginal KPI. In other words, we include the impact of past spend that still influences current KPI growth.
Formula:
Adstocked KPI = Σ(Past Spend × Decay Rate)This ensures that the mROAS calculation takes into account both current and past spending effects on the channel, resulting in a more accurate marginal KPI.
2. Saturation Transformation (Diminishing Returns)
For each media channel, the relationship between spend and KPIs is non-linear. This means that after a certain point, increasing spend yields progressively smaller KPI improvements. To account for this, Lifesight uses the Saturation transformation, which models the diminishing returns in each channel.
Formula:
Saturation = KPI / (Spend + Half Saturation Point)This transformation ensures that as spend increases, the marginal KPI (mROAS) decreases, accurately reflecting the reality of diminishing returns.
3. Marginal KPI and Marginal Spend
Once the Adstock and Saturation transformations are applied, we calculate the marginal KPI and marginal spend for each channel. This is done by simulating the effect of a small increase in spend on each channel and measuring the additional KPI generated.
Steps:
- Baseline KPI: Measure the KPI (e.g., revenue, conversions) at the current spend level.
- Incremental Spend: Simulate increasing the spend by a small amount (e.g., 1% increase).
- Marginal KPI: Measure the additional KPI generated by the incremental spend.
- Marginal Spend: Record the incremental spend that was applied.
Finally, the mROAS for that channel is calculated as:
mROAS = (Incremental KPI) / (Incremental Spend)This process is repeated for all channels, and the results are used to determine how future budget should be allocated.
Visualizing mROAS and Saturation Curves
At Lifesight, we visualize saturation curves for each media channel to show how spend impacts KPIs. These curves help marketers understand where they are experiencing diminishing returns and where there may still be room for additional investment.
Key Points on Saturation Curves:
-
Carryover: This point on the curve reflects the impact of past campaigns (the "carryover effect"). Even without current spend, the channel will still generate some KPI growth due to the lingering effects of past investments.
-
Initial Spend: The current level of spend and its associated KPI is plotted to give a benchmark for comparison.
-
Optimized Spend: Based on mROAS, we can calculate the optimal spend point—where the channel generates the highest KPI return per incremental dollar spent.
These curves provide a clear representation of when it makes sense to increase, decrease, or maintain spending on a particular channel.
Budget Allocation Based on mROAS
The goal of mROAS is to ensure that marketing budgets are optimally allocated across channels. By using mROAS to guide decisions, businesses can shift spend to the channels that will generate the highest incremental KPI returns, thereby maximizing overall campaign performance.
Steps to Optimize Budget Allocation:
- Evaluate Current Spend: Start with the current allocation of spend across channels.
- Calculate mROAS for Each Channel: Using the methodology described above, calculate the mROAS for each channel.
- Reallocate Budget Based on mROAS: Shift the budget from channels with lower mROAS to those with higher mROAS, ensuring that every incremental dollar is working as hard as possible.
- Monitor Saturation: Continuously monitor the saturation curves to ensure that additional spend doesn’t push a channel into diminishing returns.
Example of Budget Reallocation:
- Channel A has an mROAS of 2.0, meaning every additional dollar spent yields $2 in revenue.
- Channel B has an mROAS of 4.0, meaning every additional dollar spent yields $4 in revenue.
In this case, it would make sense to shift budget from Channel A to Channel B until the mROAS converges and the marginal returns between the two channels are balanced.
The Convergence of mROAS
As we continue to optimize the allocation of marketing budgets, the mROAS across channels tends to converge. This is known as the equilibrium state, where each channel is generating roughly the same marginal KPI return. At this point, additional reallocation will not significantly improve overall performance, and the budget is said to be optimally distributed.
Key Points:
- Equilibrium State: When mROAS for all channels reaches a similar value, indicating that the budget is distributed in the most efficient way possible.
- Continuous Monitoring: While achieving equilibrium is ideal, ongoing monitoring is essential to account for changes in external factors (e.g., seasonality, market conditions) and maintain optimal budget allocation.
Conclusion
mROAS is a powerful tool for optimizing marketing spend at a granular level, ensuring that every incremental dollar is working to maximize KPI returns. By focusing on the marginal efficiency of ad spend and incorporating adstock and saturation transformations, Lifesight's methodology enables businesses to make data-driven decisions that lead to higher efficiency and greater overall campaign performance.
This methodology ensures that marketing budgets are dynamically adjusted in real-time based on the marginal KPI returns generated by each channel, leading to more precise, profitable, and effective marketing strategies.
For further information on adstock transformation, saturation curves, or budget optimization techniques, refer to the related methodology articles available in the Lifesight documentation.
At Lifesight, we are committed to helping businesses maximize the effectiveness of their marketing investments. One of the key metrics that we use to optimize marketing campaigns is mROAS—Marginal Return on Ad Spend. Unlike traditional ROAS, which measures the overall return on all ad spend, mROAS specifically quantifies the return on the next dollar spent, allowing businesses to make more granular and optimized decisions about budget allocation.
This document will provide a detailed explanation of mROAS, how it is calculated for every channel, and how it helps in making informed, data-driven decisions for budget allocation.
In the next section learn how Lifesight figures out the right hyper-parameters for transformations
Updated 8 months ago