Journeys
View customer journeys across marketing touchpoints and see the most efficient path that led to a conversion.
The customer journey view provides a graphical representation of different touchpoints that users interact with before making a purchase. At each stage, you can see how many customers converted, the number of touchpoints involved, and view which were the most influencial marketing channels that helped in the conversion process.
Use cases for customer journeys:
- Identify Pathways to Conversion: Determine the most frequent customer routes leading to purchases or desired actions.
- Optimize Ad Channel Combination: Find the most effective mix of advertising channels to maximize marketing ROI.
- Analyze Campaign Paths: Evaluate the performance of marketing campaigns within a single channel or across multiple channels to refine strategies.
How to access customer Journeys
Once you have successfully integrated your website/store and your ad channels, you will have access to the Customer Journey report to analyze your attribution data from end to end. (Lifesight will track conversions post UTM configuration)
- Navigate to the Analyze Page
- Navigate to the Customer Journey tab to analyze the different paths your customers take before they convert.
- Selected starting touchpoint - the journey changes based on the selected starting touchpoint.
- The journeys are sorted in descending order of conversions. In the example below, Google as a starting touchpoint leads to the most conversions, followed by direct, etc.
- You can also apply filters to your Custom Journey report if you'd only like to see certain journeys. (Attribution models and window filters do not affect this view since journeys are independent of these.).
Filters:
- Filter the journeys by Key Performance Index(KPI) - Add to Carts, Purchases, Customer Registrations, Form Submits, Checkouts Created (The purchases option is a “superset” of all the other events.)
- Filter journeys based on the State / City of the shipping address used in a purchase. (Only purchases satisfying the geo filters are shown in the purchase journey.)
Users can also view the purchase metrics of each stage
- CV (Conversion Value) - Total value of purchases (conversions) resulting from the selected touchpoint.
- AOV (Average Order Value) - Average Order Value of purchases (conversions) resulting from the selected touchpoint.
- Average time between selected touchpoints between stages.
Exploring the Journeys Tab: Understanding Customer Journeys and Top Customer Journeys
The Journeys tab in the Attribution Dashboard is an essential tool for marketers seeking to gain a deeper understanding of how customers interact with their brand across multiple touchpoints before making a conversion. The tab is divided into two key views: Customer Journeys and Top Customer Journeys, each providing unique insights into the paths customers take and how these paths contribute to your overall marketing success.
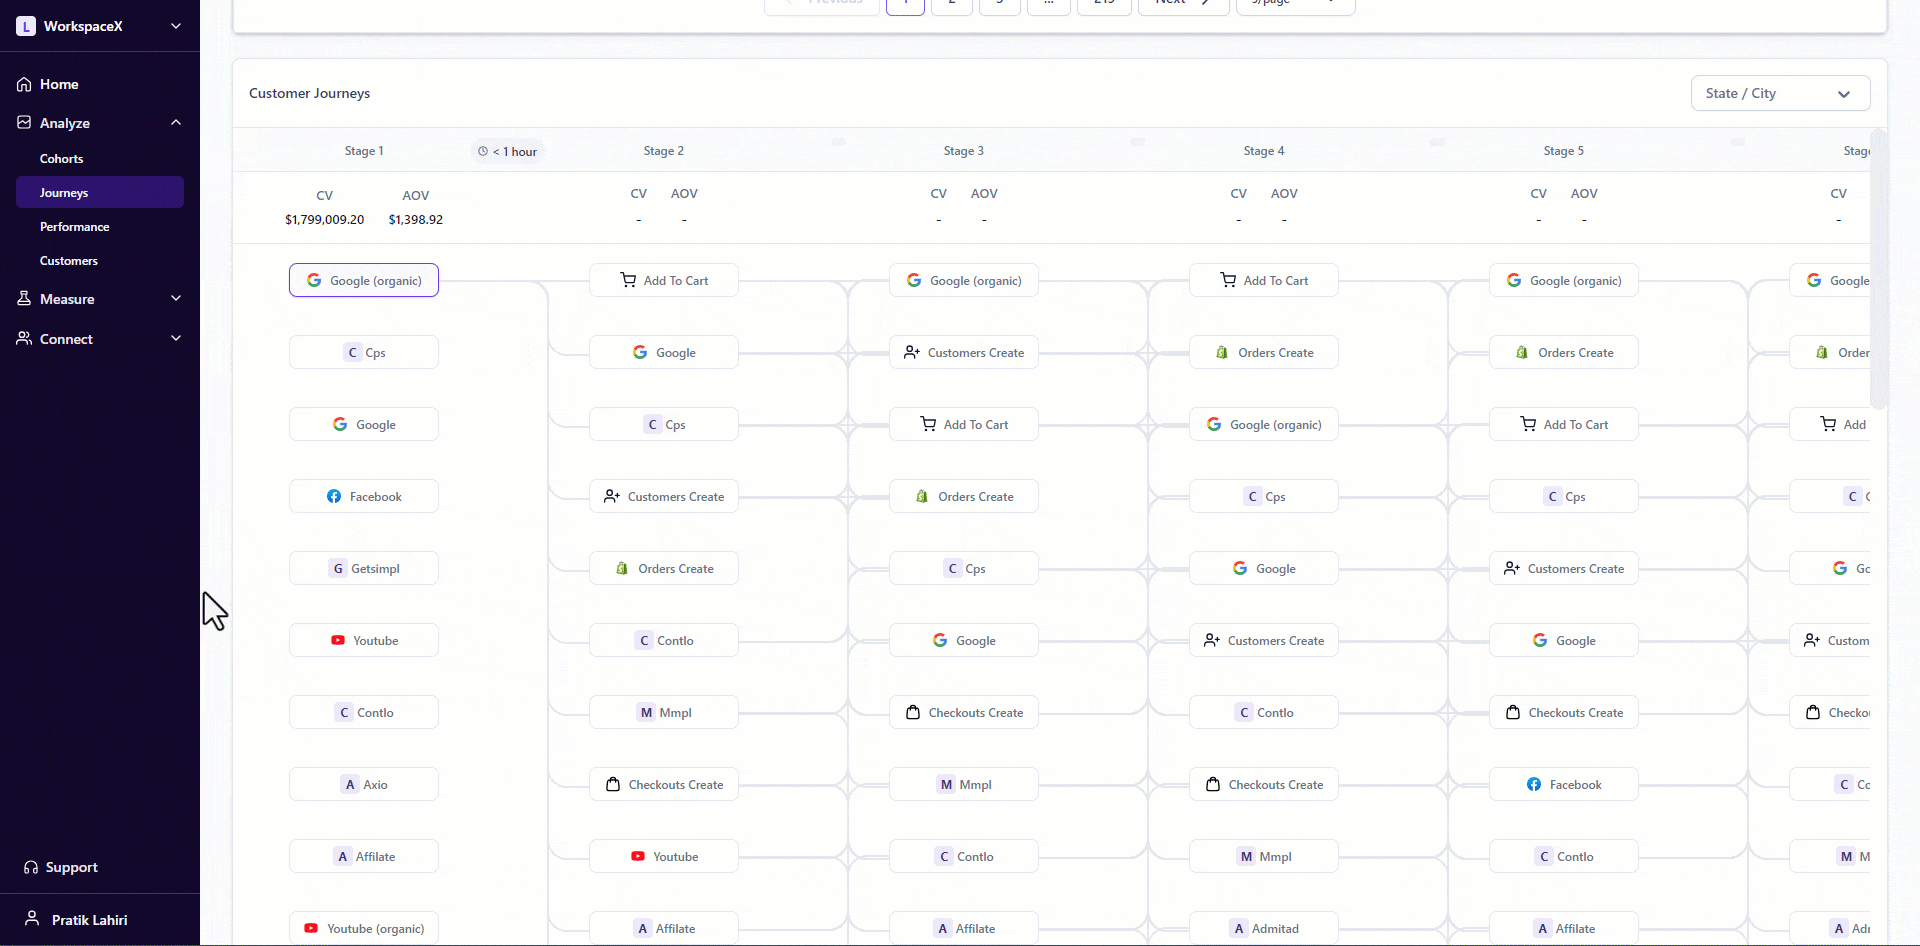
Customer Journeys: Tracking the Path to Conversion
Customer Journeys offer a detailed look at the entire path a customer takes from their first interaction with your brand to the final conversion or purchase. This view is invaluable for understanding the complexities of the customer experience and the effectiveness of various marketing strategies.
Key Aspects of Customer Journeys:
-
Multiple Touchpoints: Customers typically interact with a brand through various channels before making a purchase. The Customer Journeys view captures these multiple touchpoints, allowing you to see the sequence of interactions that lead to conversions. This insight helps you identify which channels are most influential at different stages of the journey.
-
Conversion Value and Average Order Value: Each stage in the journey provides details on the Conversion Value (CV) and Average Order Value (AOV). These metrics are crucial for understanding the financial impact of each touchpoint, helping you optimize your marketing spend by focusing on the most profitable interactions.
-
Time Analysis: The average time between stages is displayed, giving you a clear picture of how long it takes for customers to move from one touchpoint to the next. This time analysis helps you identify potential delays or friction points in the customer journey, enabling you to streamline the process and enhance the overall customer experience.
-
Starting Touchpoints: The ability to analyze journeys based on different starting touchpoints allows you to see how various initial interactions lead to conversions. By understanding which starting points are most effective, you can tailor your marketing strategies to initiate journeys that are more likely to result in a conversion.
Understanding these customer journeys enables marketers to identify the most effective channels, optimize their strategies, and ultimately improve the overall customer experience. By visualizing the complete path to conversion, you can make data-driven decisions that enhance your marketing effectiveness and drive better results.
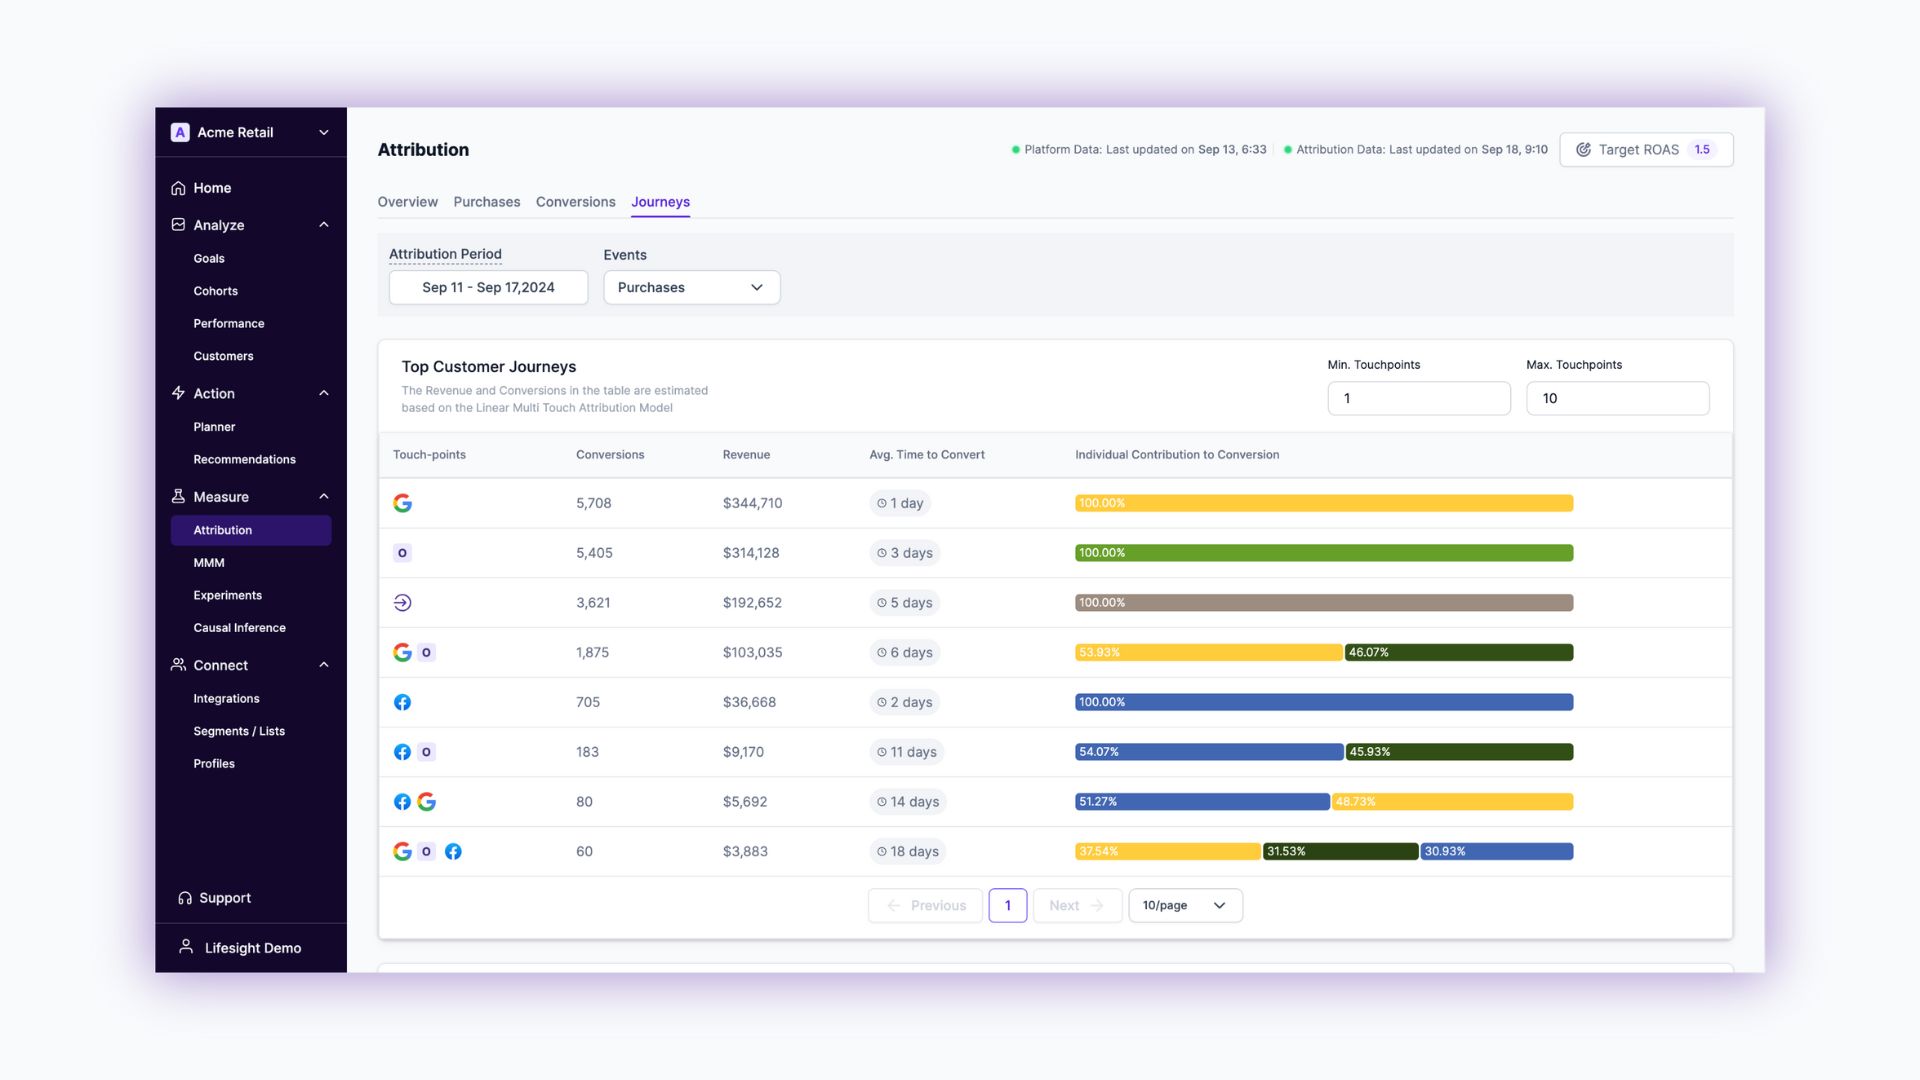
Top Customer Journeys: Aggregated Insights for Optimized Decision-Making
While the Customer Journeys view provides detailed insights into individual customer paths, the Top Customer Journeys view offers a more aggregated perspective. This view is designed to help you identify the most effective combinations of channels and touchpoints that drive conversions and revenue.
Key Aspects of Top Customer Journeys:
-
Aggregated Journeys Table: The Top Customer Journeys view presents an aggregated table that showcases distinct touchpoints for each journey. Each row in this table represents a combination of touchpoints that have collectively contributed to customer conversions. This allows you to see which combination of touchpoints are most successful.
-
Sorting by Revenue, Conversions, or Average Time to Conversion: You can sort the journeys based on different metrics such as revenue generated, the number of conversions, or the average time to conversion. This flexibility allows you to focus on the aspects that matter most to your marketing goals, whether it’s maximizing revenue, increasing conversion rates, or speeding up the conversion process.
-
Visual Representation of Touchpoint Contributions: The view includes visual representations of how individual touchpoints contribute to conversions. This visualisation makes it easier to understand the impact of each touchpoint within the journey, helping you pinpoint which interactions are driving the most value.
-
Filtering by Number of Touchpoints: The ability to filter journeys based on the number of touchpoints provides additional granularity. You can analyze simple, short paths to conversion or dive into more complex, multi-touchpoint journeys to understand how they differ in effectiveness.
This feature helps marketers understand which combination of channels and touchpoints are most effective in driving conversions and revenue. By offering a high-level view of successful customer journeys, the Top Customer Journeys view enables more informed decision-making, empowering you to refine your marketing strategies for better results.
Conclusion
The Journeys tab in the Attribution Dashboard is a powerful tool that provides deep insights into customer behavior and the effectiveness of your marketing channels. Whether you're analyzing individual customer paths in the Customer Journeys view or aggregated insights in the Top Customer Journeys view, this tab equips you with the knowledge needed to optimize your marketing efforts and drive meaningful results. By leveraging these insights, you can enhance your understanding of the customer journey, improve channel effectiveness, and ultimately achieve greater marketing success.
Updated over 1 year ago