Overview
Get a quick summary of your overall ad performance across multiple channels
The Overview Dashboard provides a quick summary of your ad performance across multiple channel. It encompasses both revenue and non-revenue metrics that are fundamental to your business operations.
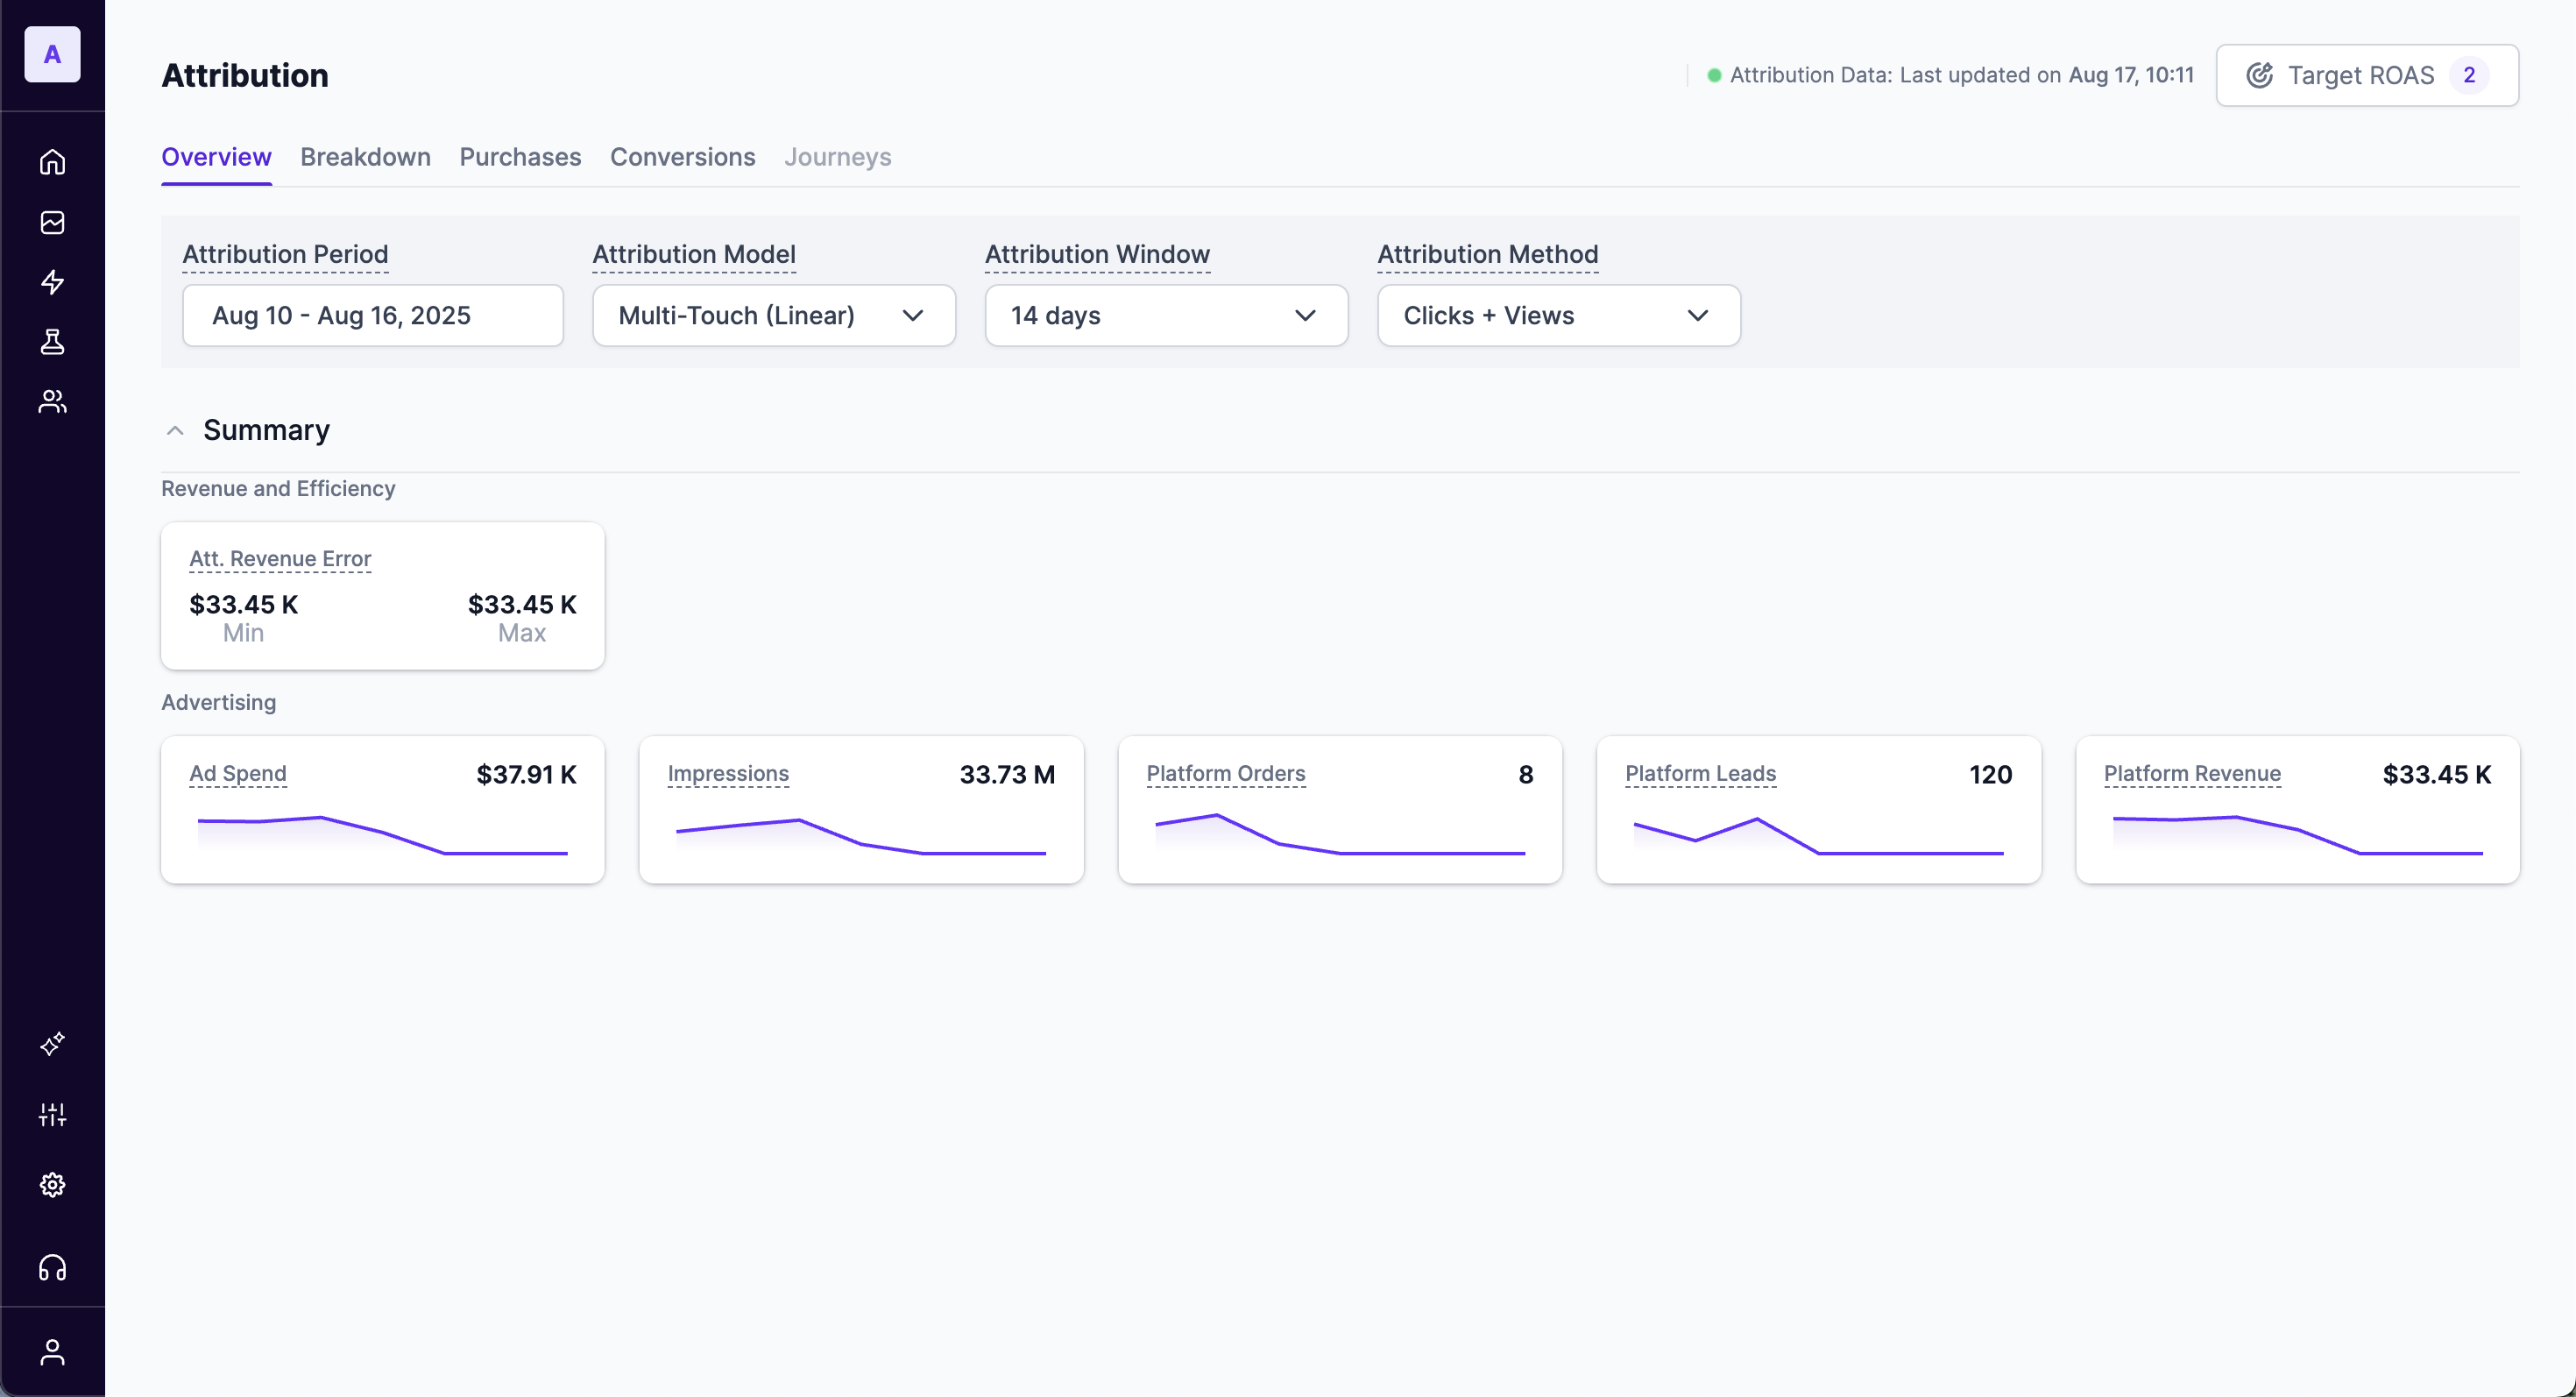
The Overview tab contains the following sections:
- Attribution status
- Target Benchmark KPI
- Metrics Summary
- Attribution Chart
- Channel Breakdown
View interactive demo
Key Components
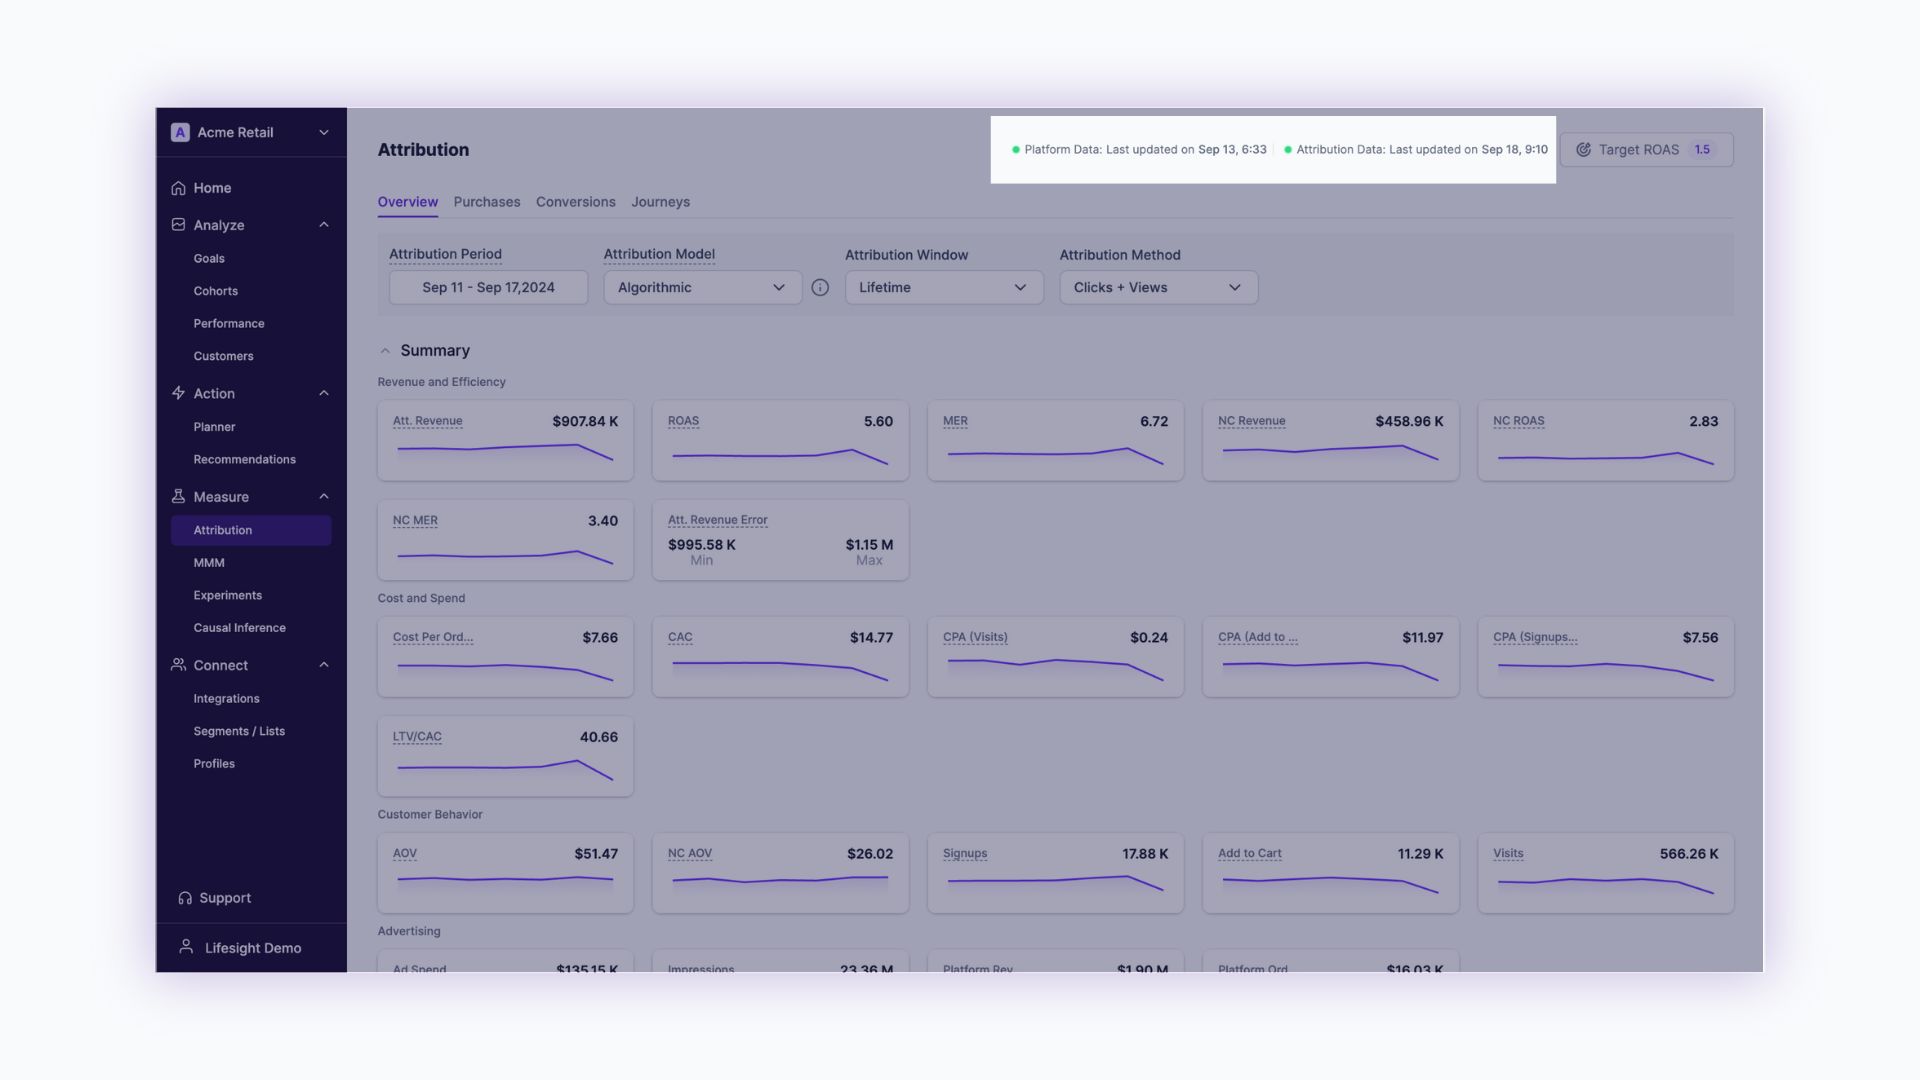
Attribution status
The status indicators help understand when was the last Platform data and Attribution data synced to your Lifesight Attribution dashboard.
- Platform data - Hover over the platform data to view when was the last time each of your ad channels had a data sync. Incase there any integration with a ad channel is broken, users would be able to see a last time stamp when the data was synced.
- Attribution data - Hover over the platform data to view when was the last time each of your attribution data was synced. If you make changes to Rules and Labelling, the Attribution data would need to refresh based on the mentioned rules and would show the latest timestamp of the data sync. While data is updating you would see a "Processing" status marked in the Attribution dashboard.
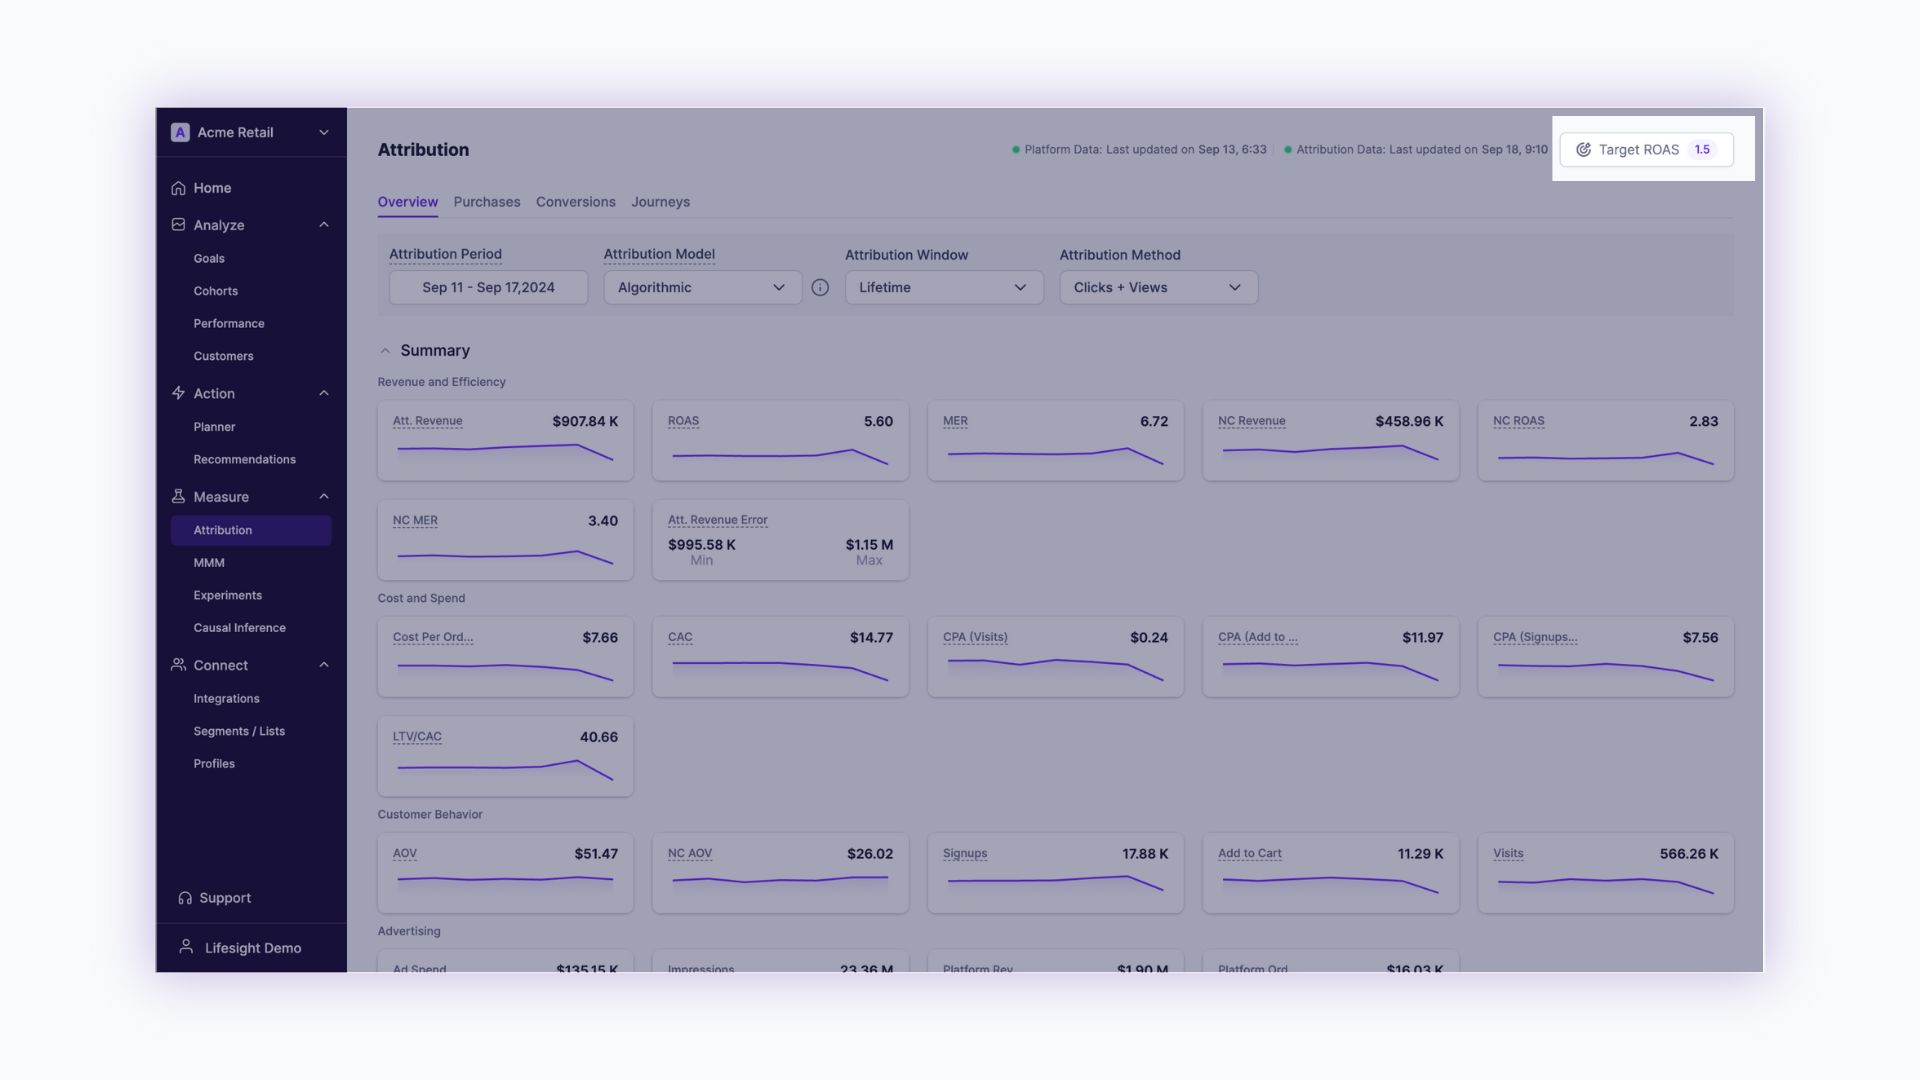
Target Benchmark KPI
Target Benchmarks are useful when a business wants to input their Target KPI and optimize their marketing efforts to achieve the goal. Click to learn more about Target Benchmark
Attribution period
Select a date range to apply to your attribution reports. By default, the data is showcased for the previous seven days.
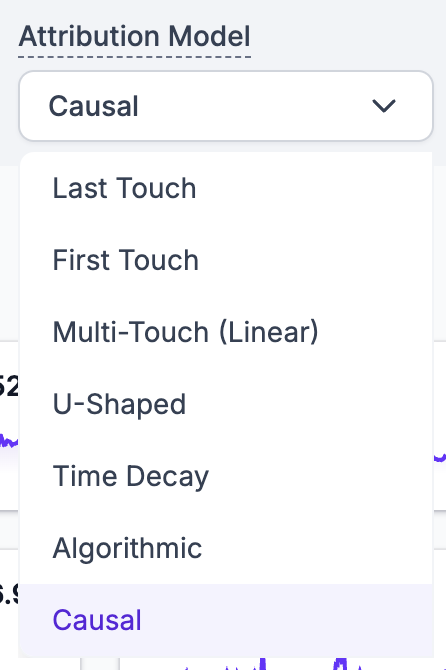
Attribution Model
Choose between different Attribution models such as Last Touch, First Touch, Multi-Touch (Linear), U-Shaped, Time Decay, Algorithmic, and Causal.
Algorithmic modelWe enable algorithmic model 14 days after integrating all your data sources. Lifesight runs an algorithm independently to give credits to various touch points for the algorithmic model. We give credit to all the touch points in converting paths. But at the same time, we would penalize all the touch points in non converting paths.
How does Causal model work?Causal model works when you select a Default Scenario. Hover over the info help indicator to view which models the causal attribution model is based on. You can have multiple default scenarios and the causal model autopicks the best plans for a KPI to calibrate platform attribution reports with the MMM incrementality factor.
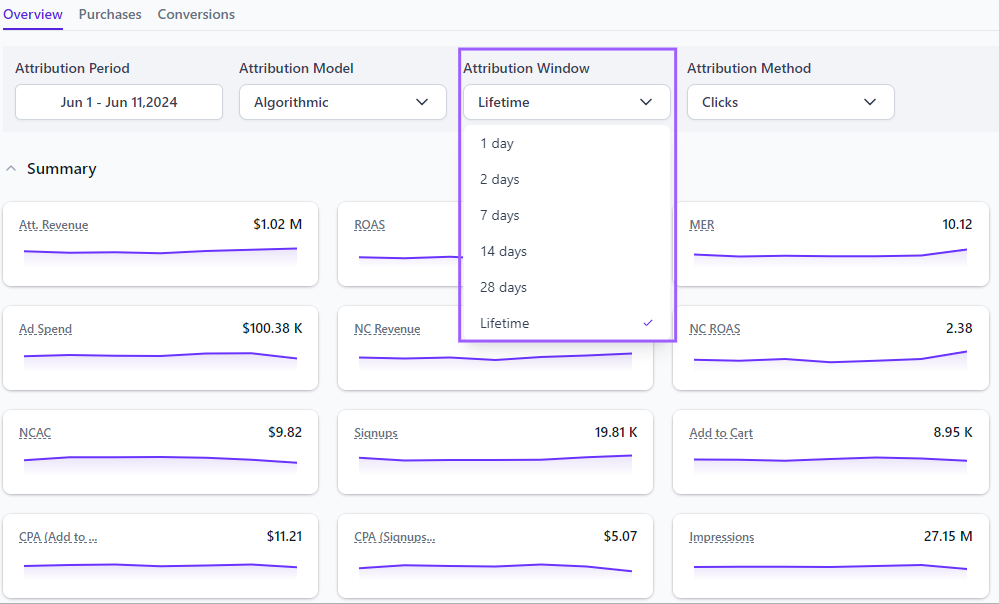
Attribution window
An attribution window is the number of days between when a person viewed or clicked your ad and subsequently took action.
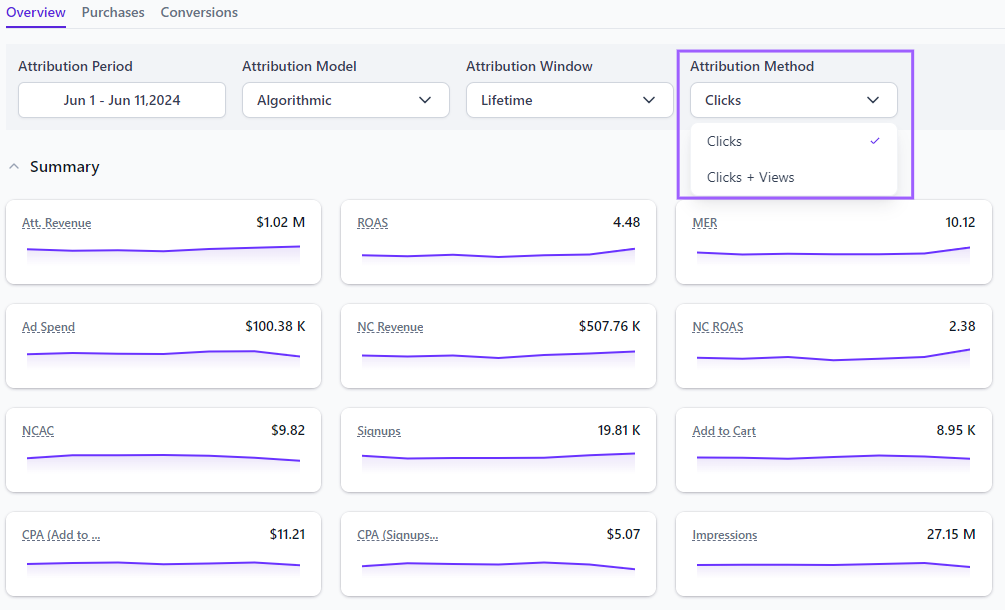
Attribution Method
We measure ad actions based on clicks and views of your ad:
- Click-through attribution: A person clicked your ad and took an action.
- View-through attribution: A person saw your ad, didn't click it, but took an action within the attribution window.
Read more on how View-Through Attribution works (coming soon)
Summary of Key Metrics
The Overview dashboard displays the metrics you select by aggregating the touchpoint data, cost data, and event data from various sources.
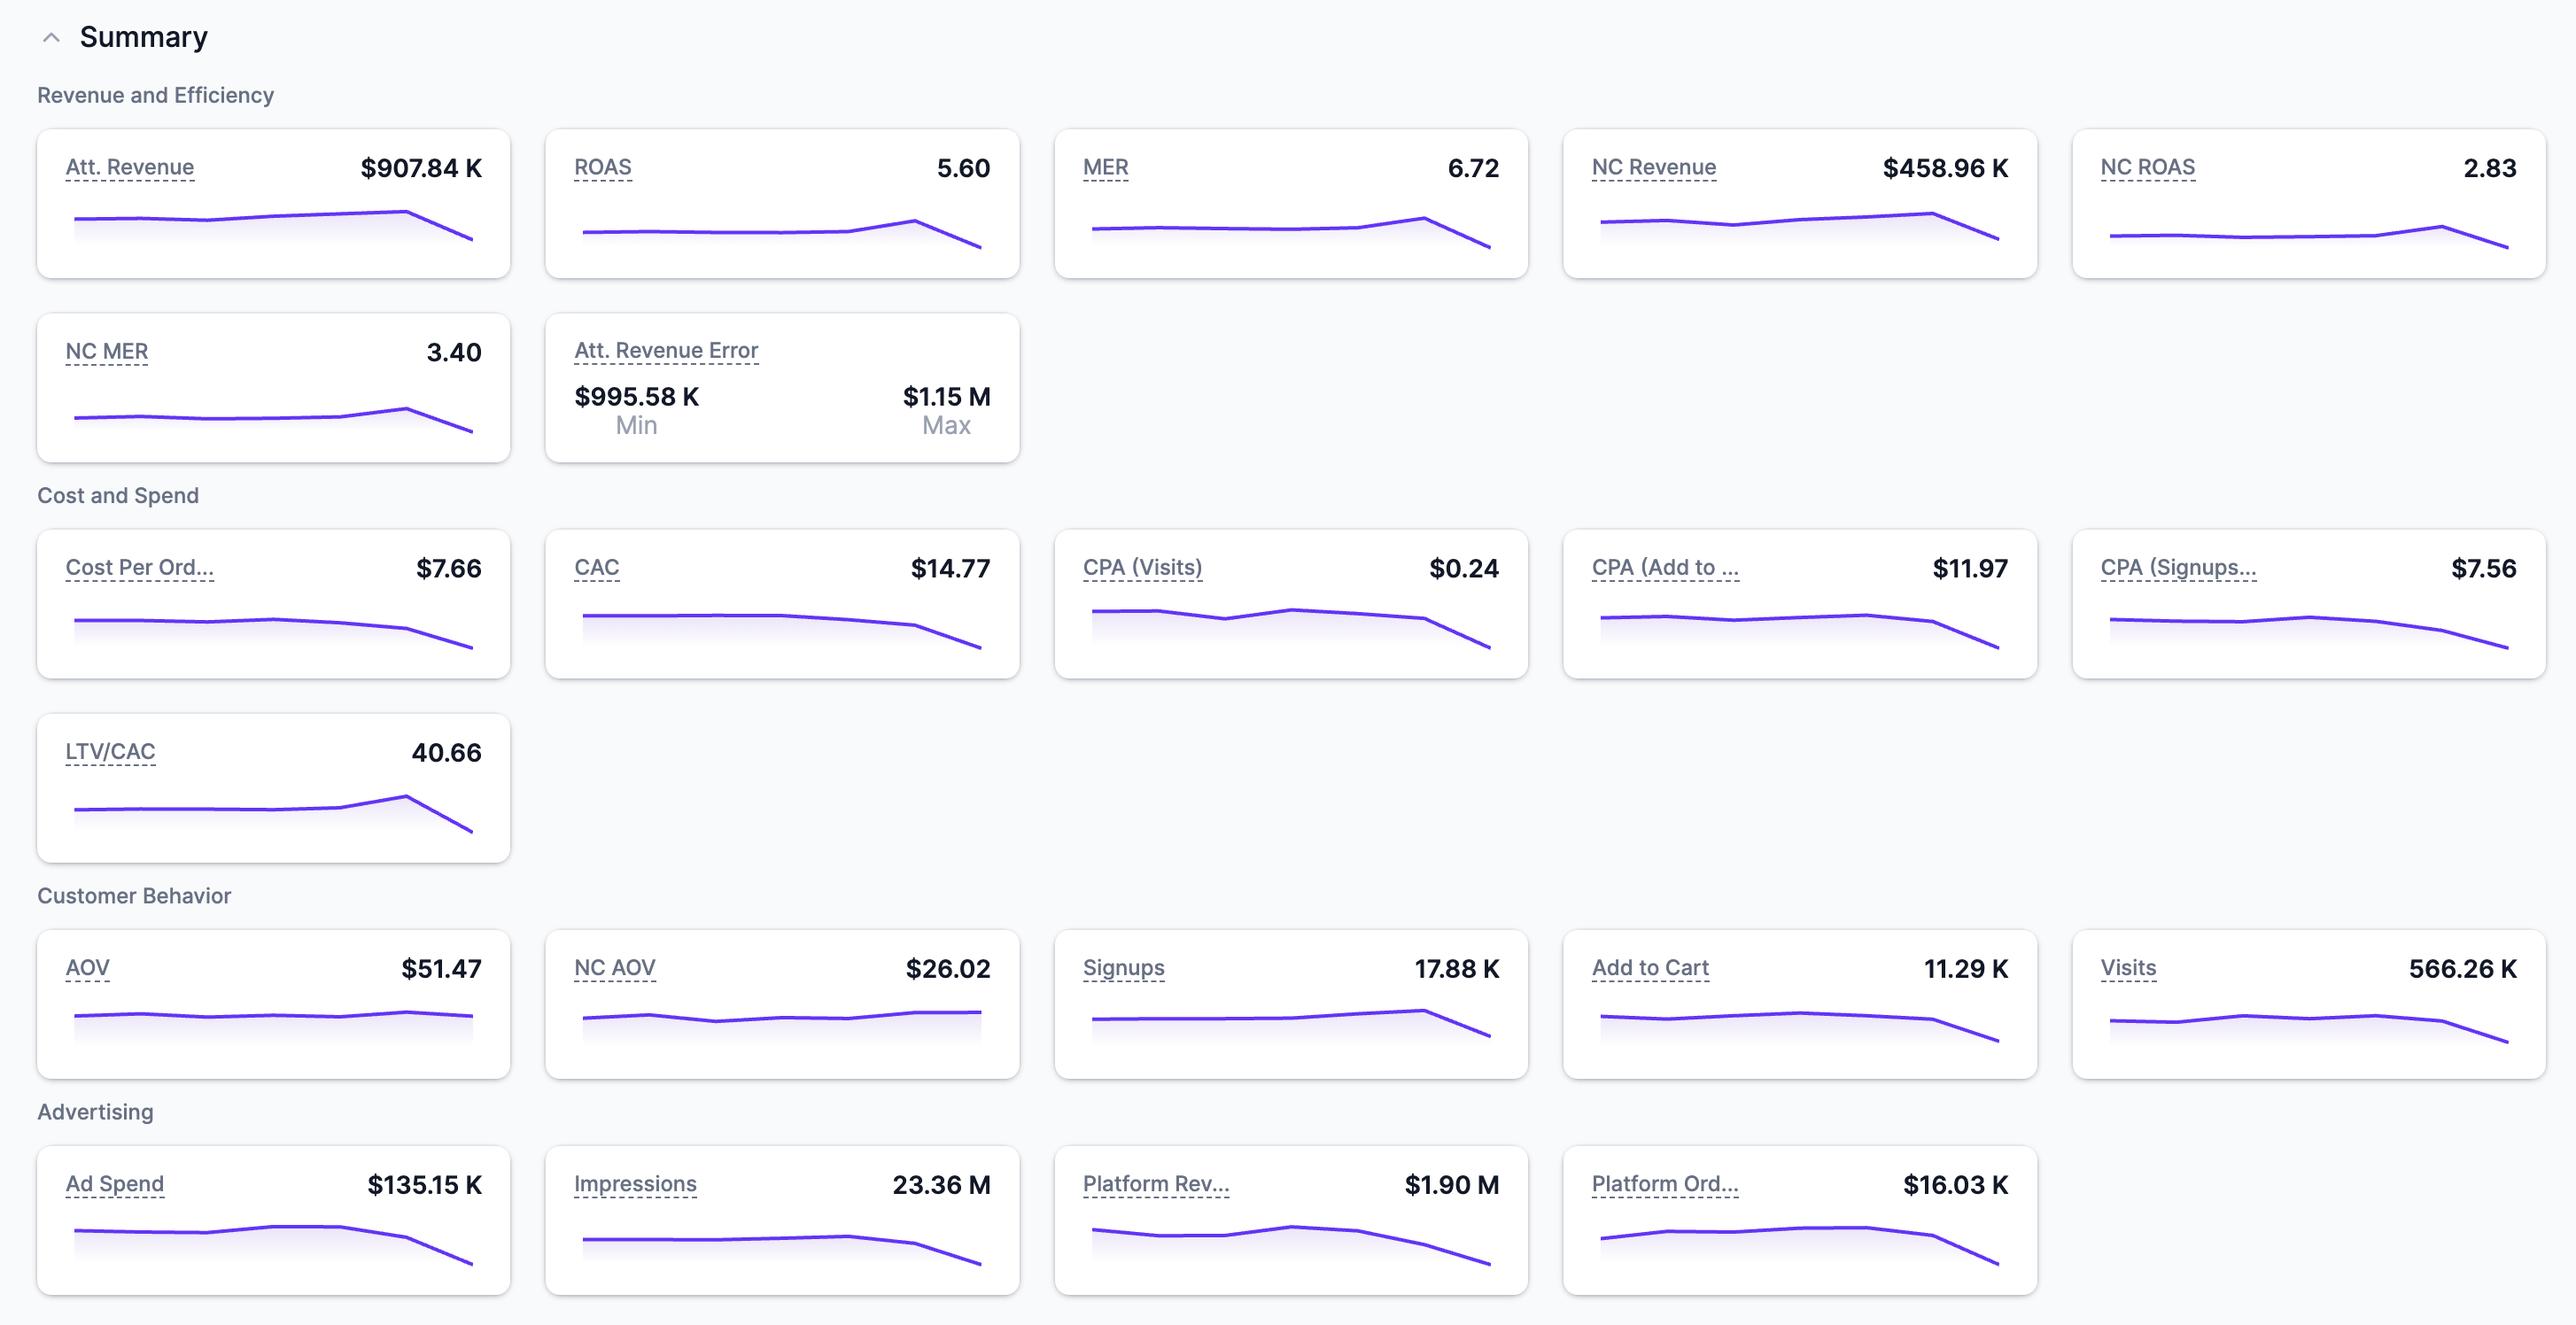
The metrics are categorized as:
- Revenue and Efficiency - Att. Revenue, ROAS, MER, NC Revenue, NC ROAS, NC MER, Att. Revenue Error
- Cost and Spend - Cost Per Order, CAC, CPA (Visits), CPA (Add to Cart), CPA (Signups), LTV/CAC
- Customer Behavior - AOV, NC AOV, Signups, Add to Cart, Visits
- Advertising - Ad Spend, Impressions, Platform Revenue, Platform Orders
- Non-Revenue KPIs - pOrders, pRegistrations, pAddtoCart, pLeads, pRevenue (existing)
Incremental metrics are shown only for Causal Attribution models
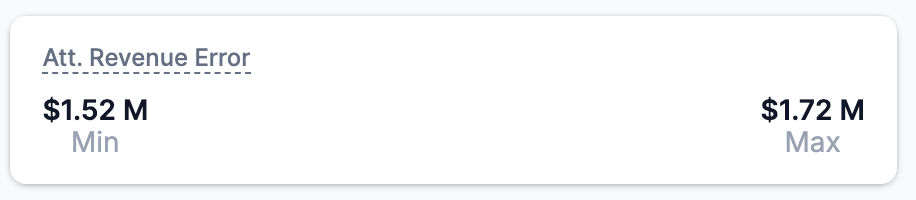
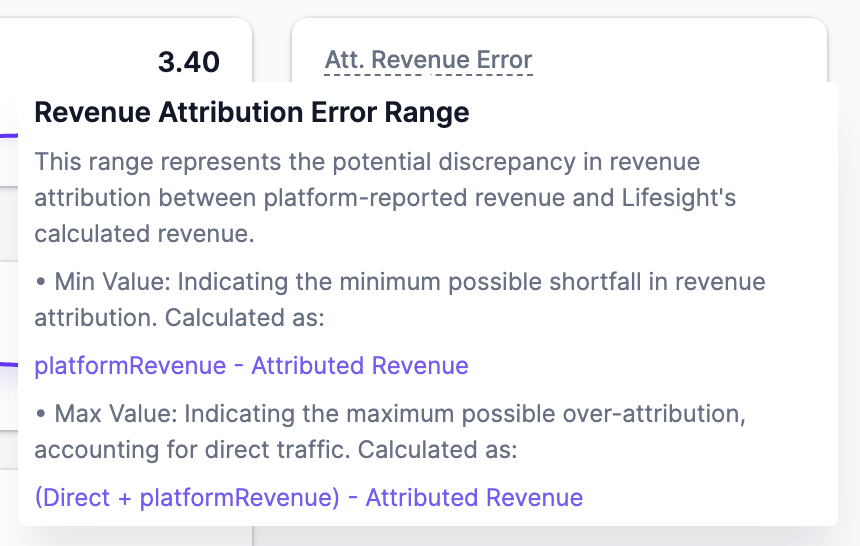
Attribution Error range (only shown for Causal Attribution models)This metrics highlights the potential discrepancies between platform-reported revenue and Lifesight's calculated revenue.
Key Details:
- Min Value: Represents the minimum possible shortfall in revenue attribution. Calculated as the difference between
platformRevenueandAttributed Revenue.- Max Value: Represents the maximum potential over-attribution, calculated as
(Direct Traffic + platformRevenue) - Attributed Revenue.This feature is designed to help users better understand the accuracy of platform-reported revenue figures, providing insights into the extent of revenue attribution errors.
Click here to get a detailed explanation in the Attribution metrics guide.
How are metrics calculated?Hover over each metric name to view the definition and formula used to calculate the metric values.
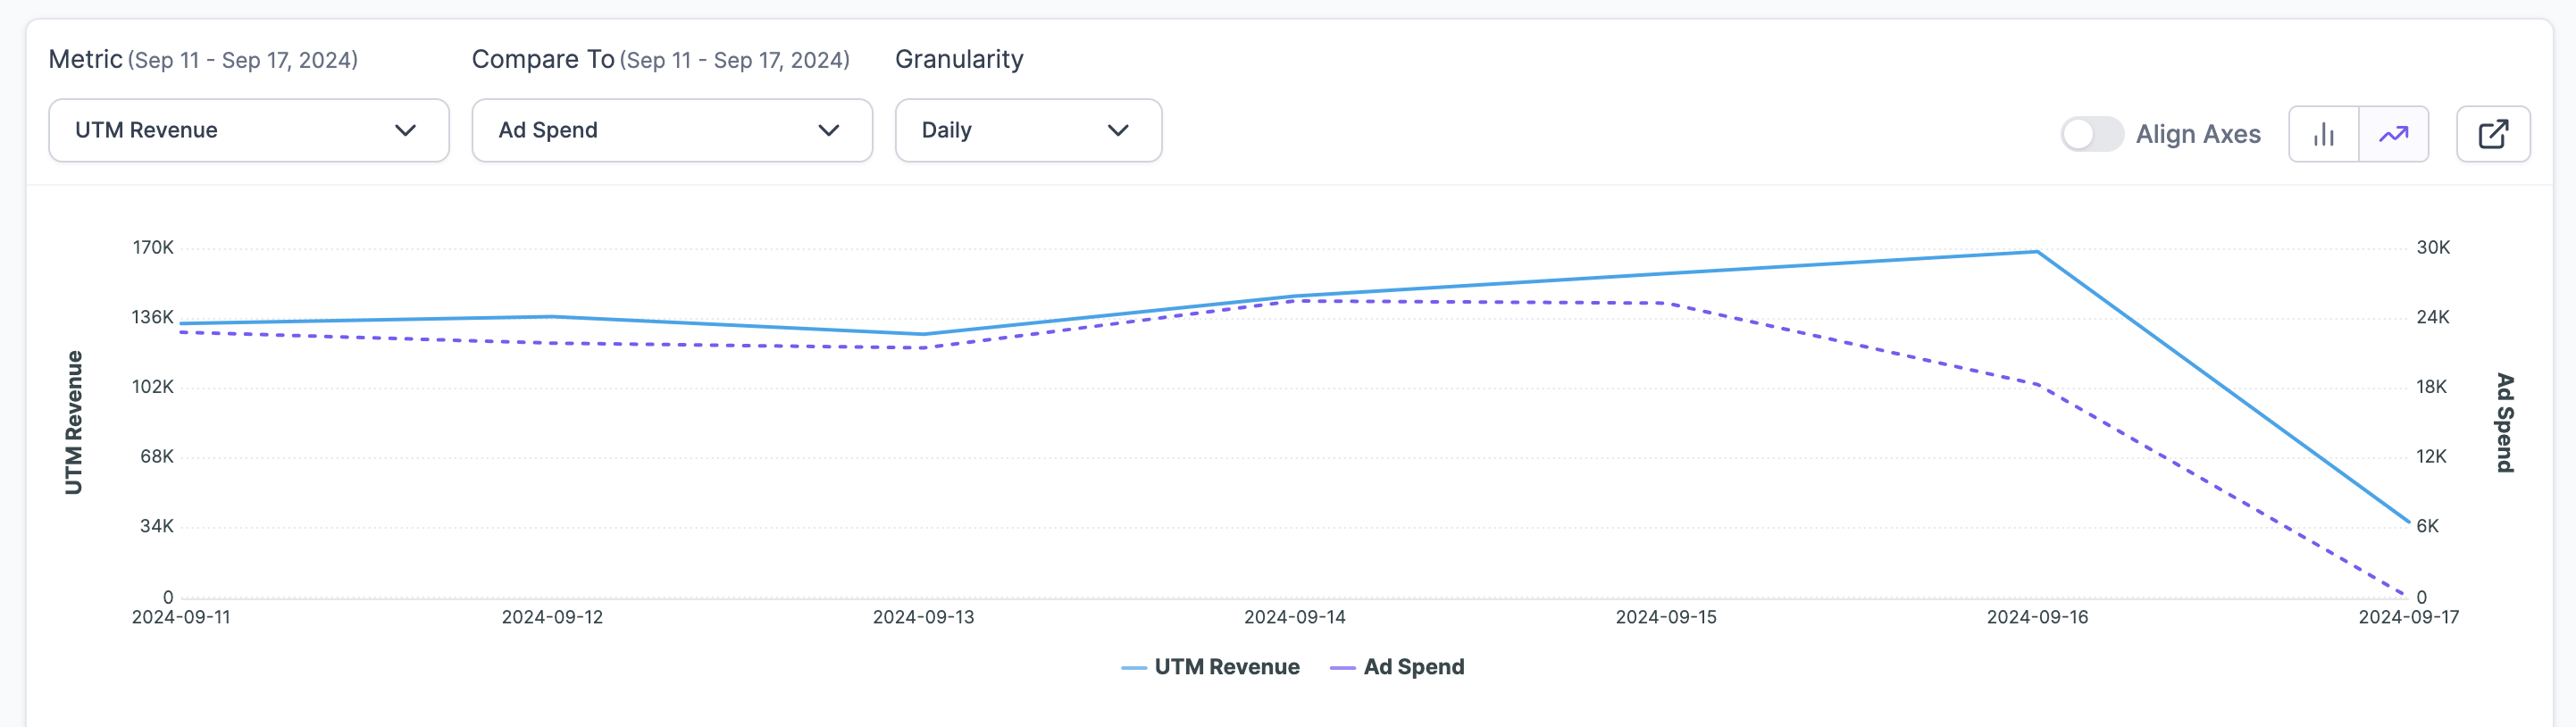
Attribution chart
This powerful chart lets users compare metrics across dimensions, time period and channels to uncover hidden patterns and opportunities.
Easily switch between line and bar charts for a fresh perspective on your data, helping you quickly spot trends and insights. Export your charts and data in formats like PNG, JPG, PDF, SVG, CSV, and XLSX for seamless integration into presentations and reports. Align chart axes for accurate, scale-to-scale comparisons, ensuring more precise and meaningful data analysis.
Learn more about Attribution charting
Channel Breakdown
The Channel Breakdown chart provides a comprehensive view of ad channel performance at a granular level, allowing for drill-down analysis into smaller, more specific subsets.
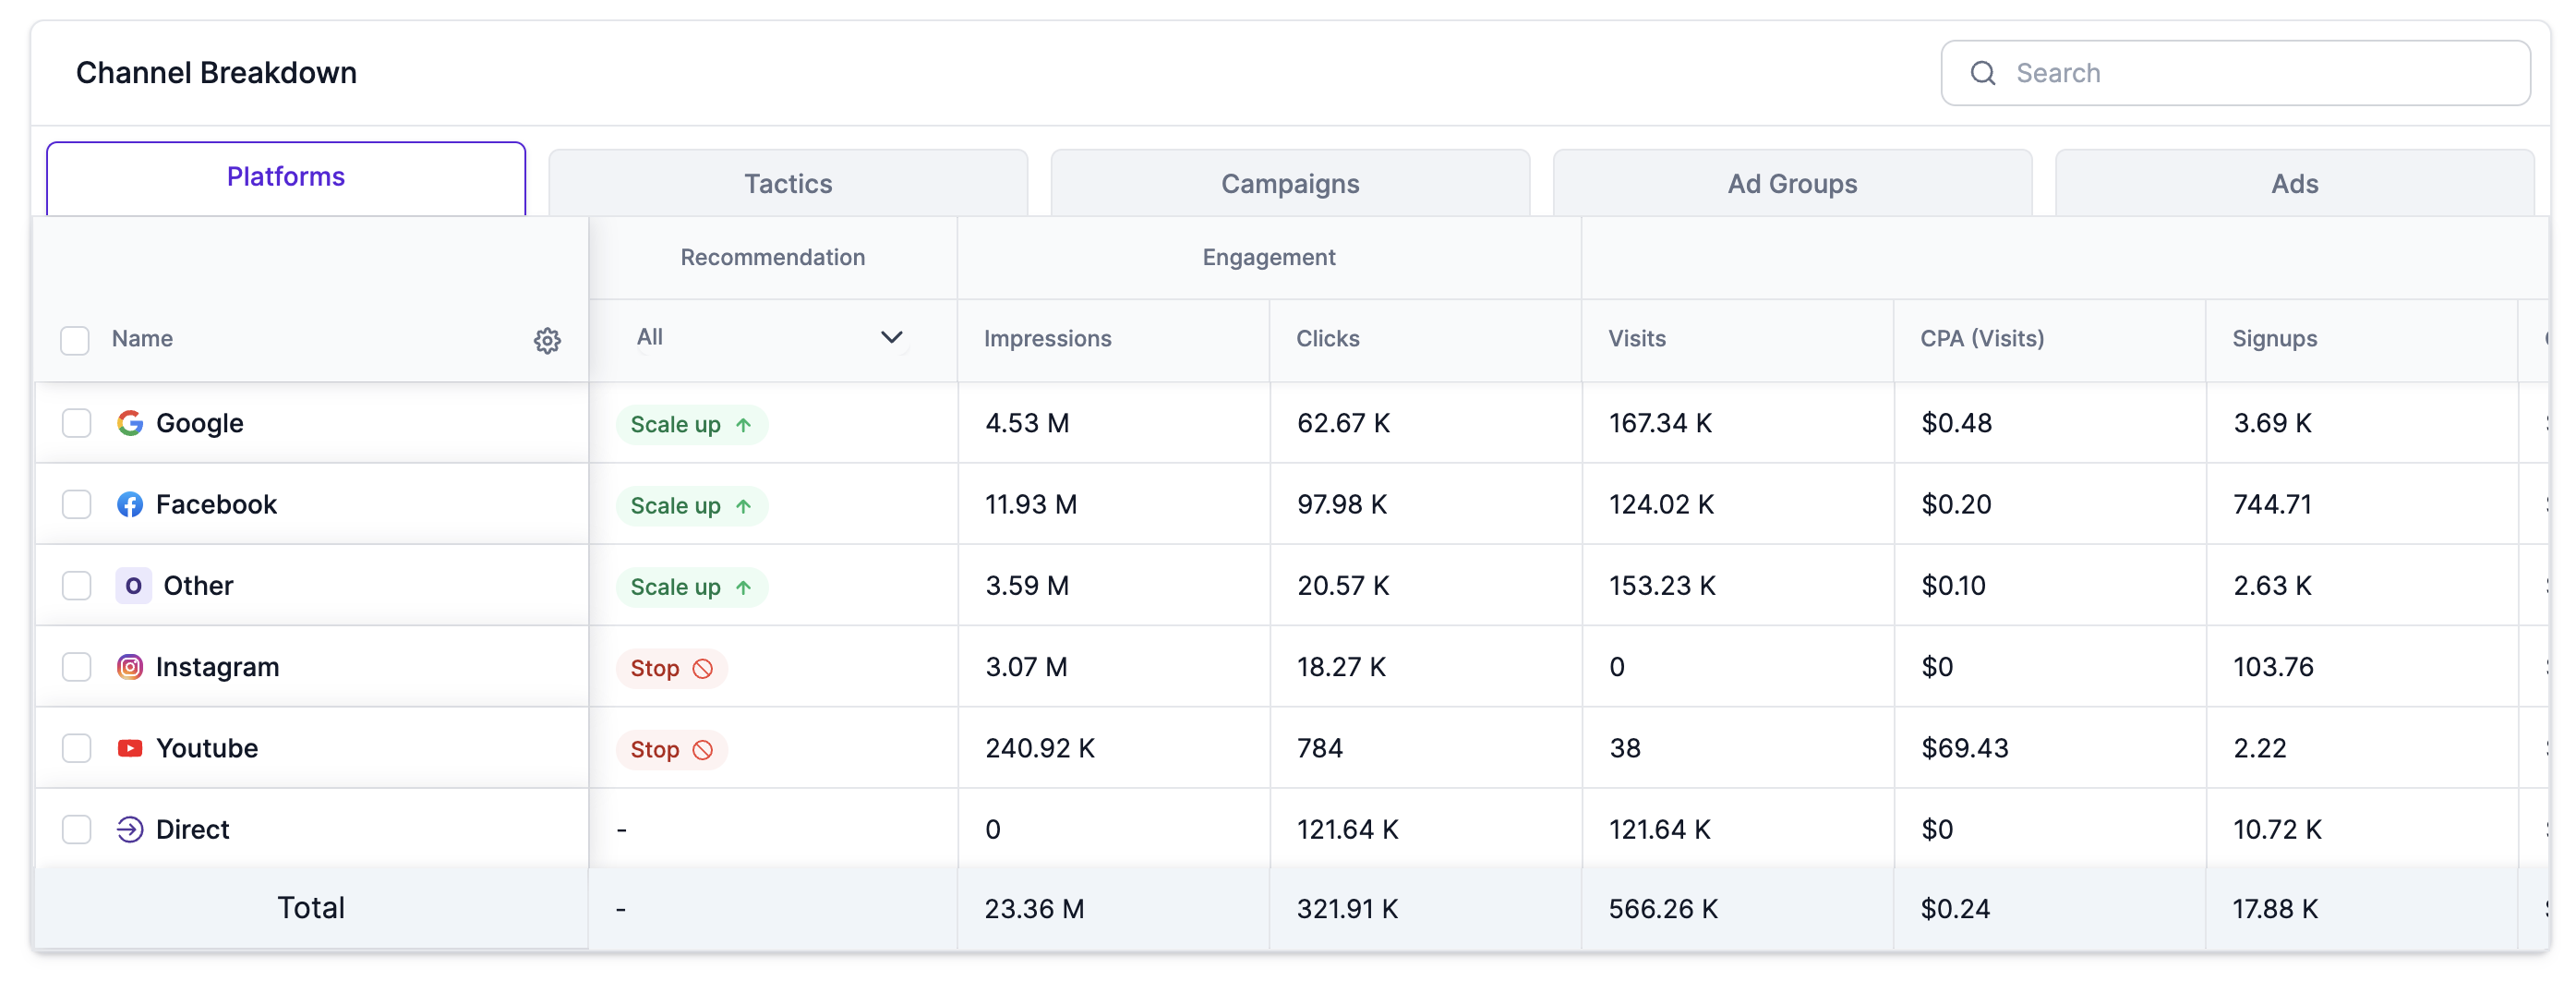
By delivering actionable insights through Recommendations like "Scale up" or "Stop," the tool helps optimize marketing efforts based on your Target Benchmark metrics set in the Attribution dashboard. Click here to learn on Target Benchmarks
The channel performance is analyzed across the following levels:
- Channel, Campaign, Objectives, Ad Groups, Ads
Performance metrics are organized into the following categories:
| Metric category | Metric |
|---|---|
| Engagement | Clicks Impressions |
| Conversions | Visits CPA(Visits) Signups CPA( Signups) Form Submits CPA (Form Submits) Add to Carts CPA (Add to Carts) pOrder pCPA |
| Revenue | AOV pRevenue UTM Revenue (As captured by pixel + attribution methodology selected in the filters) Channel vs UTM UTM New Revenue |
| Purchases | Purchases New Purchases CPO CAC LTV/CAC |
| Spend | Spend |
| ROAS (Return on Ad Spend) | pROAS UTM ROAS (As captured by pixel + attribution methodology selected in the filters) UTM NC ROAS (As captured by pixel + attribution methodology selected in the filters) |
| Time to Convert | Conversion rate Average 25th Percentile 50th Percentile 75th Percentile Tmax |
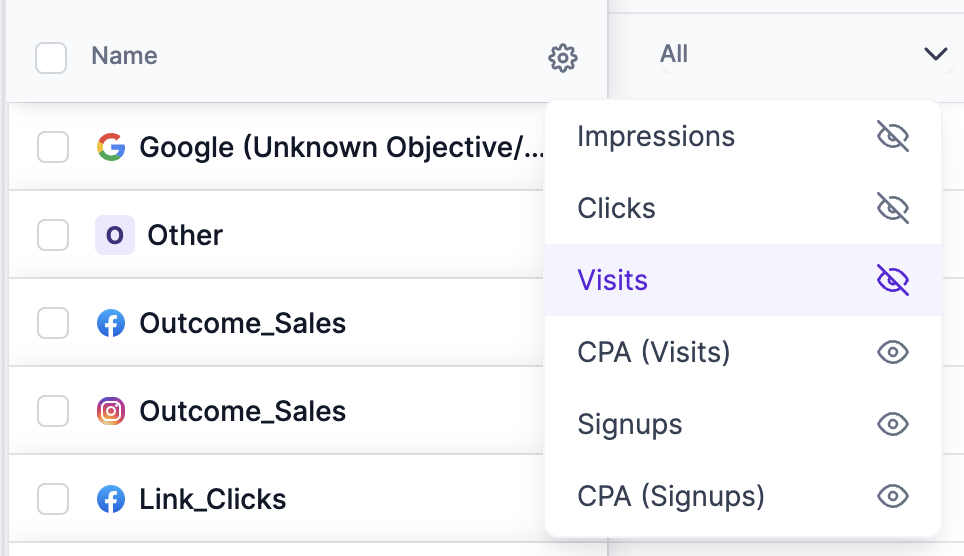
NoteThe "Settings" icon in Name section of the table helps filter the metrics you want to view in your Channel Breakdown table.
Updated 11 months ago