
Contribution: Understand what each channel contributes to revenue
Review channel contribution, efficiency, response, and uncertainty.
Contribution answers the question every marketer has to defend in a budget meeting: what is actually driving revenue?
It breaks your outcome down across paid media, baseline (the demand you'd get anyway, without marketing), contextual factors (outside influences such as seasonality, holidays, or promotions), halo effects (when one channel lifts results in another), organic activity, and unknown. This shows you how much each group really contributes and how efficiently it works.
From there, you can check response (how much additional lift more spend would buy) and uncertainty (how confident the model is in each number) before you make any budget decisions.
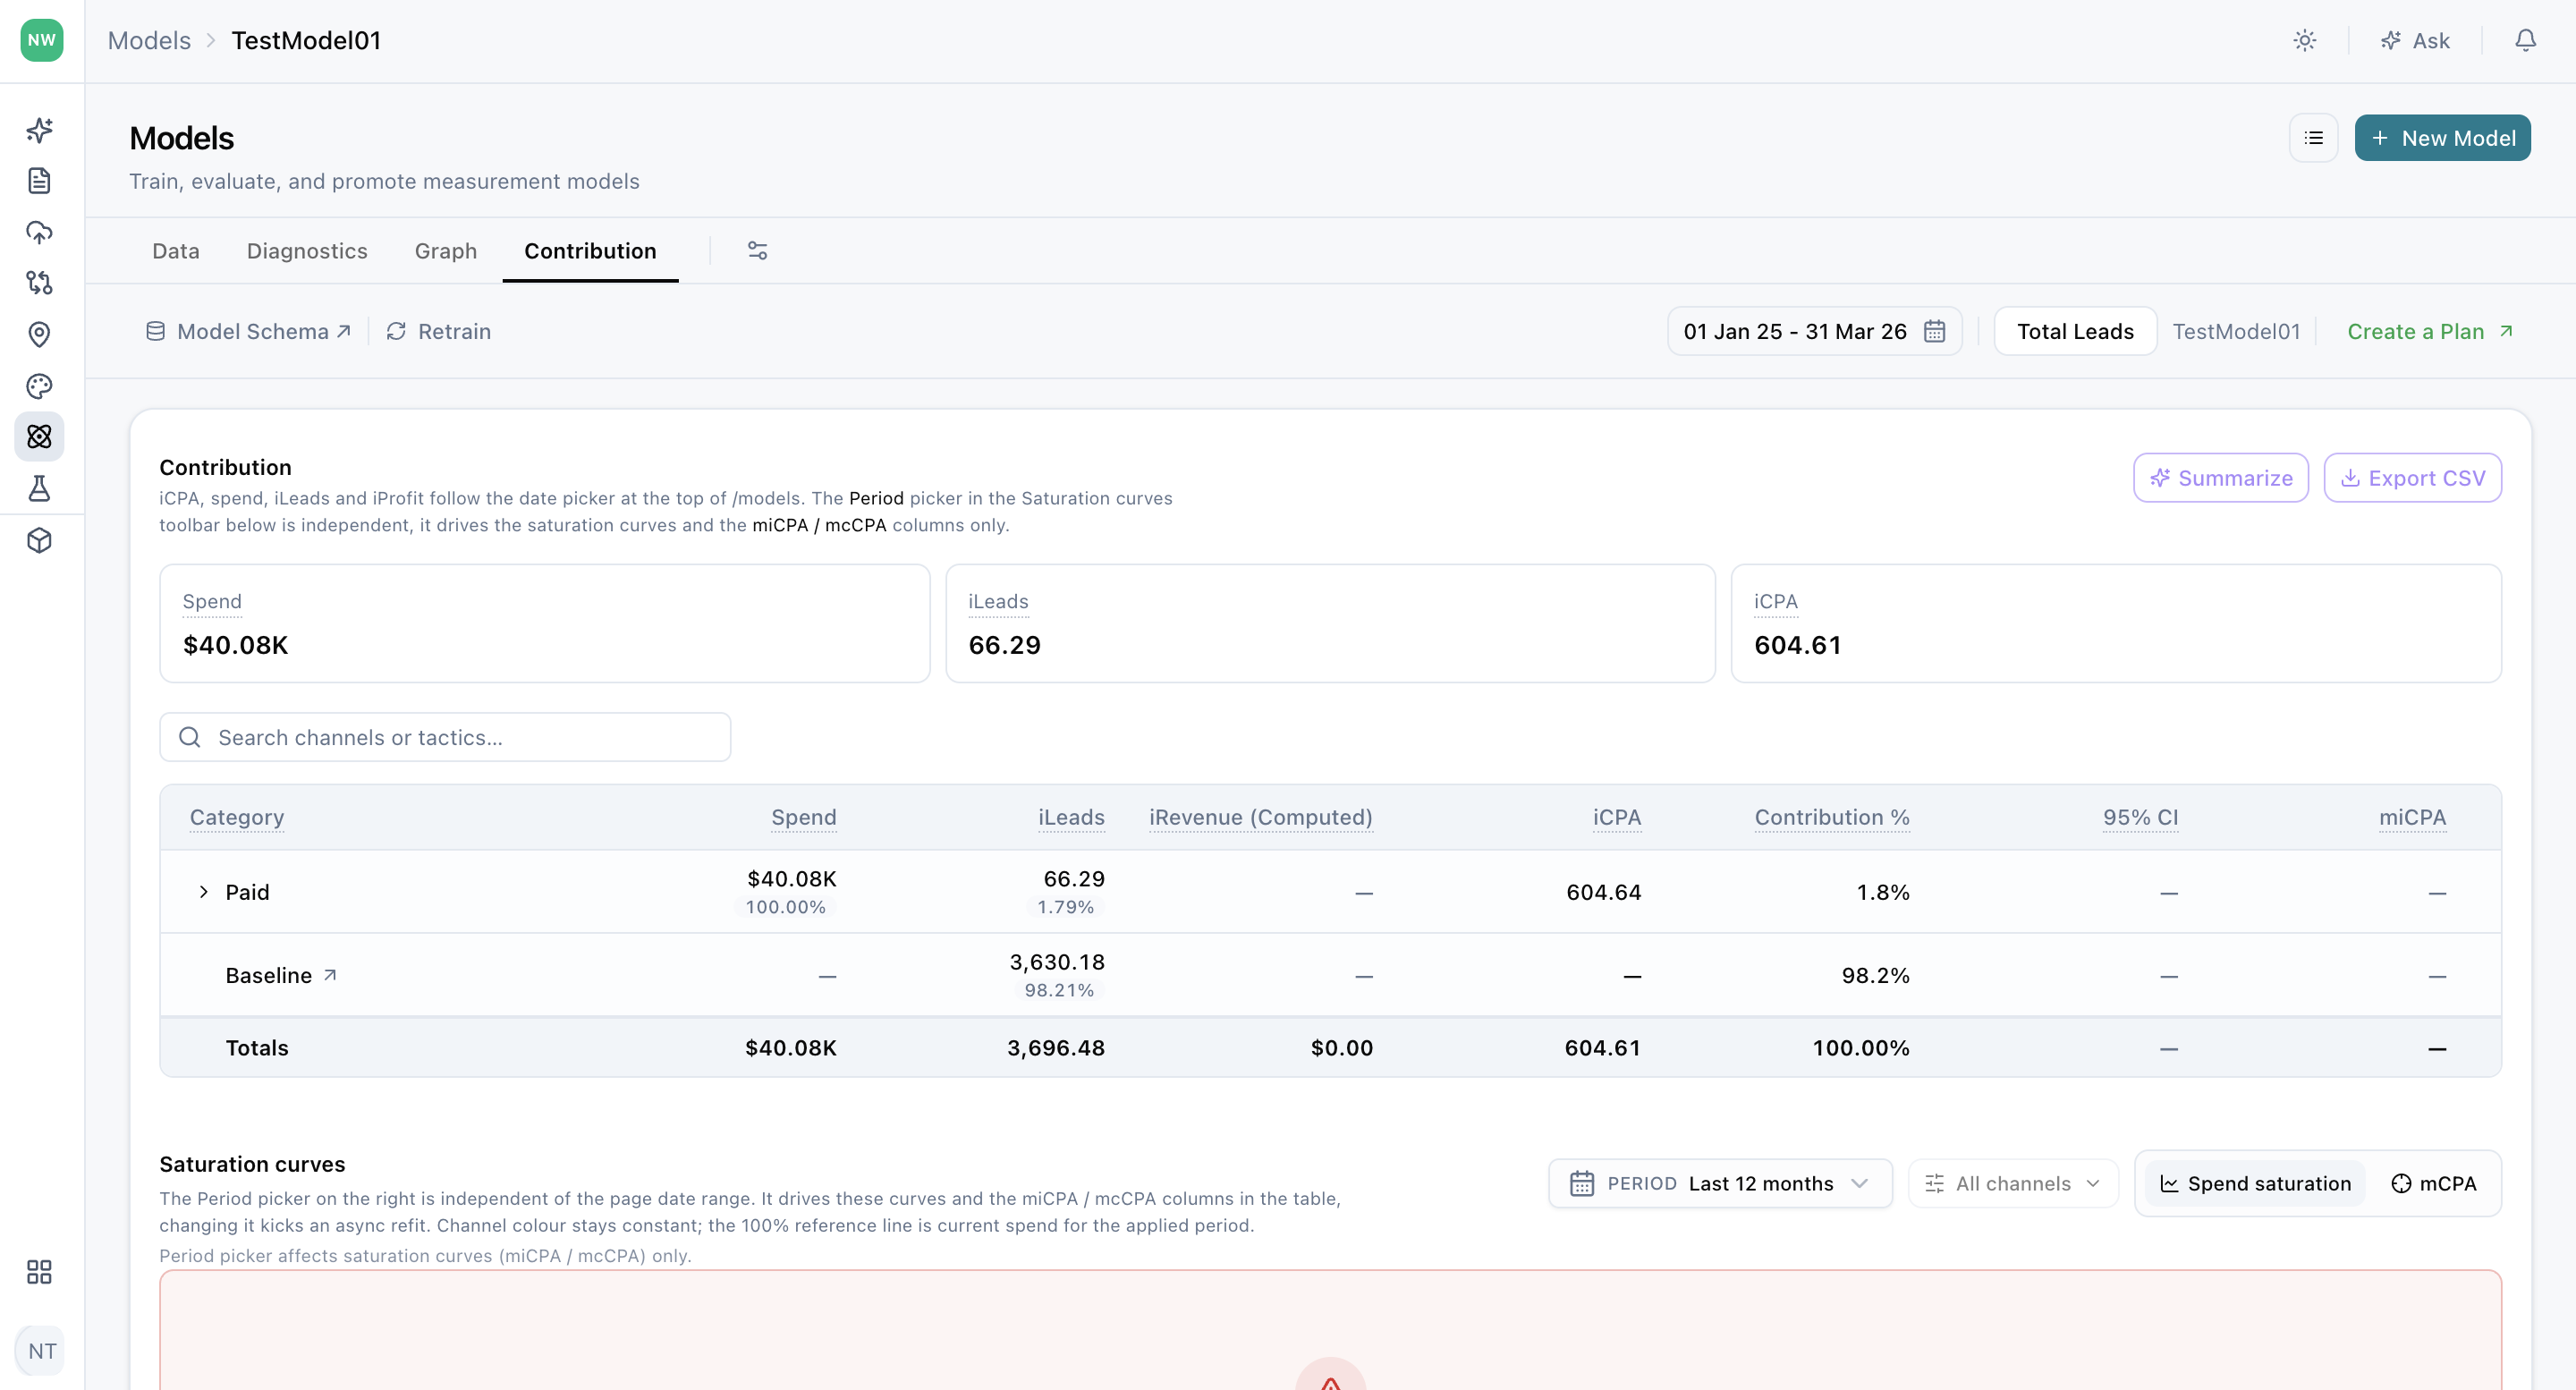
Get a channel-by-channel view of performance
The contribution table shows results for each channel. Expand a channel to see results for its individual tactics.
The columns available depend on your model's outcome and cost configuration. They can include:
- Spend: how much was invested in the channel or tactic over the selected period.
- Incremental outcome: the additional revenue, orders, or other outcome the channel drove beyond what would have happened without it.
- Incremental efficiency: how efficiently the channel drives incremental results, shown as iROAS (incremental return on ad spend) for revenue models or iCPA (incremental cost per acquisition) for conversion models.
- Contribution percentage: the share of your total outcome assigned to the channel.
- Confidence interval: the range the true value is likely to fall within.
- Marginal efficiency: the return you can expect from the next dollar spent on the channel.
- Incremental profit and profit efficiency: the incremental profit the channel generated and how efficiently it did so, where cost data is available.
- Causal status: how strongly the model's causal evidence supports the estimate.
Incremental efficiency is based on the model's incremental outcome. Don't compare it directly with efficiency reported by ad platforms, since platforms measure results differently, often crediting conversions that would have happened anyway.
Look at contribution and efficiency together
Contribution and efficiency answer different questions:
- Contribution shows how much of your outcome is assigned to a driver.
- Efficiency shows the incremental outcome generated per unit of spend, or the spend required for each incremental outcome.
A channel can contribute a large share of revenue simply because it receives a large share of budget, while a smaller channel may be far more efficient.
A high-contribution channel isn't always the best place for additional spend. Review marginal efficiency and the response curve to understand what the next dollar is likely to produce. A channel with high contribution but low marginal efficiency may already be close to saturation (the point where more spend stops delivering meaningful additional results).
Know how much confidence to place in each result
Use the confidence interval to understand the range around an estimate. A narrow interval means the model is more certain. A wide interval means greater uncertainty, so treat the estimate with more caution.
To decide how much to rely on a result, combine several signals:
- Causal status for how strongly the model's causal evidence supports the estimate
- Causal Graph to see the paths through which the channel influences your outcome
- Diagnostics to check model fit and backtesting
- Experiment evidence, such as geo holdouts, to confirm results with measured lift
The Unknown group can appear when a partial refresh leaves some contribution unmatched to a driver. It isn't a causal status label.
Understand what changed between periods
When comparison is turned on, review spend, incremental outcome, and efficiency together. An increase in contribution can come from:
- More investment: the channel received more budget.
- A change in efficiency: each dollar is working harder or less hard than before.
- A different overall outcome mix: other drivers grew or shrank, changing each channel's share.
Looking at all three together helps you understand whether a channel is genuinely performing better or simply receiving more spend.
Find the right spend level with response curves
Response curves show how your outcome is expected to change at different spend levels for each channel. Use them to:
- Spot diminishing returns, where each additional dollar produces less incremental outcome than the last
- Compare current efficiency with marginal efficiency, to see whether the next dollar will perform as well as your average dollar
- Identify channels with room to scale and channels that may already be overspent
Note: The Period selector on the response curve works independently of the page's date range. It controls how the curve and the marginal efficiency fields are calculated.
To review immediate and carryover effects (how much of a channel's impact happens right away versus in the days or weeks after spend), go to Diagnostics.
Frequently asked questions
What does Contribution show in Lifesight?
Contribution breaks your outcome down across paid media, baseline, contextual factors, halo effects, organic activity, and unknown. It shows how much each group contributes to results and how efficiently it works.
What is baseline in contribution analysis?
Baseline is the demand you'd get anyway, without marketing. It's driven by factors such as brand strength, existing customers, and market demand.
What is the difference between contribution and efficiency?
Contribution shows how much of your outcome is assigned to a driver. Efficiency shows how much incremental outcome each unit of spend generates, or how much spend each incremental outcome requires.
What is incremental outcome?
Incremental outcome is the additional revenue, orders, or other result a channel drove beyond what would have happened without it.
What is incremental efficiency?
Incremental efficiency measures how efficiently a channel drives incremental results. It's shown as iROAS for revenue models or iCPA for conversion models.
Why don't my contribution results match ad platform reporting?
Ad platforms measure results differently and often credit conversions that would have happened anyway. Incremental efficiency in Lifesight is based on the model's incremental outcome, so the two shouldn't be compared directly.
What is marginal efficiency?
Marginal efficiency is the return you can expect from the next dollar spent on a channel. It helps you decide where additional budget will deliver the most.
Should I invest more in my highest-contribution channel?
Not necessarily. A channel may contribute a lot because it already receives a large budget. Check its marginal efficiency and response curve to see what additional spend is likely to produce.
Why do some columns not appear in my contribution table?
The columns available depend on your model's outcome and cost configuration. For example, incremental profit and profit efficiency require cost data.
What does the confidence interval mean?
The confidence interval is the range the true value is likely to fall within. A narrow range means more certainty, and a wide range means more uncertainty.
How do I know if I can trust a contribution estimate?
Review the confidence interval and causal status, then check the Causal Graph, Diagnostics, and any experiment evidence. Together, these tell you how much confidence to place in the result.
What is the Unknown group?
The Unknown group appears when a partial refresh leaves some contribution unmatched to a driver. It isn't a causal status label.
Why did a channel's contribution increase between periods?
An increase can come from more investment, a change in efficiency, or a shift in the overall outcome mix. Review spend, incremental outcome, and efficiency together to see which one is driving the change.
What do response curves show?
Response curves show how your outcome is expected to change at different spend levels. They help you spot diminishing returns and find channels with room to scale.
Why doesn't the response curve change when I change the page date range?
The response curve's Period selector works independently of the page date range. It controls how the curve and marginal efficiency fields are calculated.
Where can I see immediate and carryover effects?
Immediate and carryover effects are shown in Diagnostics.
Related Articles
Updated about 2 hours ago