
Breakdown: find exactly where performance is won or lost
Move from channels down to ad sets, compare planned spend with what actually worked, and act on the specific line items driving your results.
Breakdown takes the performance picture from Overview and shows you exactly where it comes from. Instead of knowing that a channel is underperforming, you can see which tactic, which campaign, and which ad set is responsible, and what to do about each one.
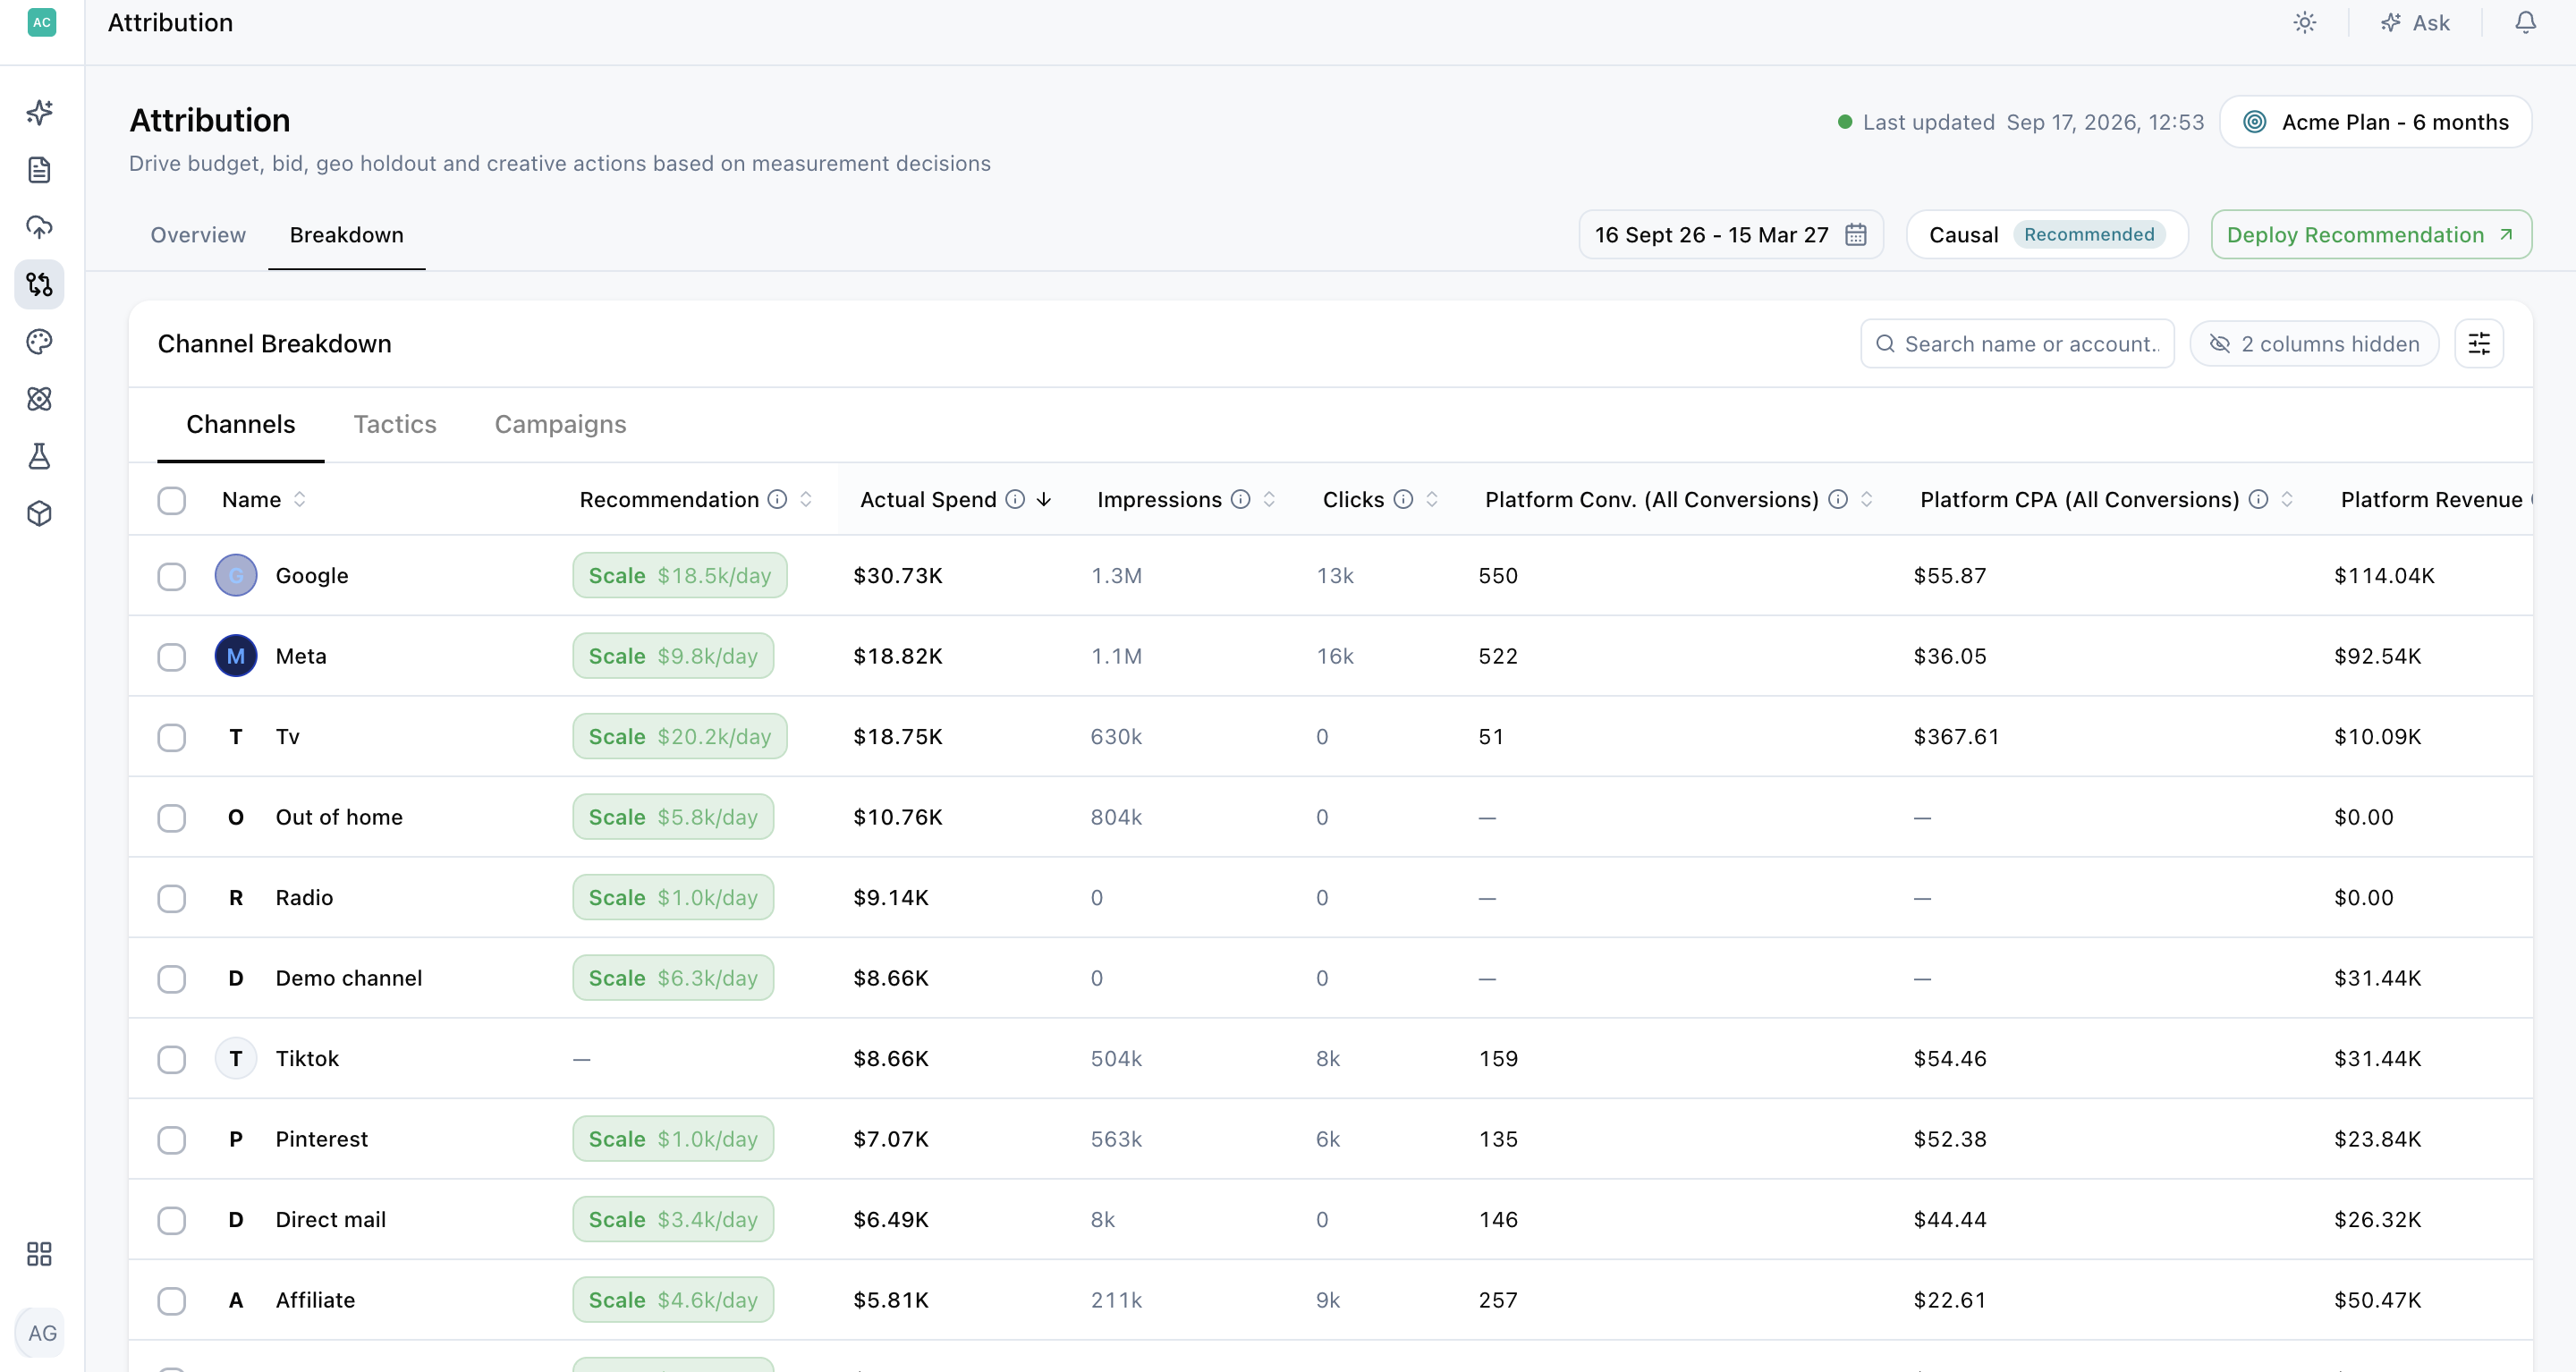
Every number here is causal, not platform-reported. That means you are ranking and cutting based on what each line item actually contributed, not on the conversions each platform claimed.
Go from symptom to cause
Follow your marketing hierarchy
Breakdown follows your marketing hierarchy. Levels appear only when there is data behind them.
- Channels: the platforms you buy on
- Tactics: the role a group of spend plays, such as prospecting or retargeting
- Campaigns
- Ad Sets
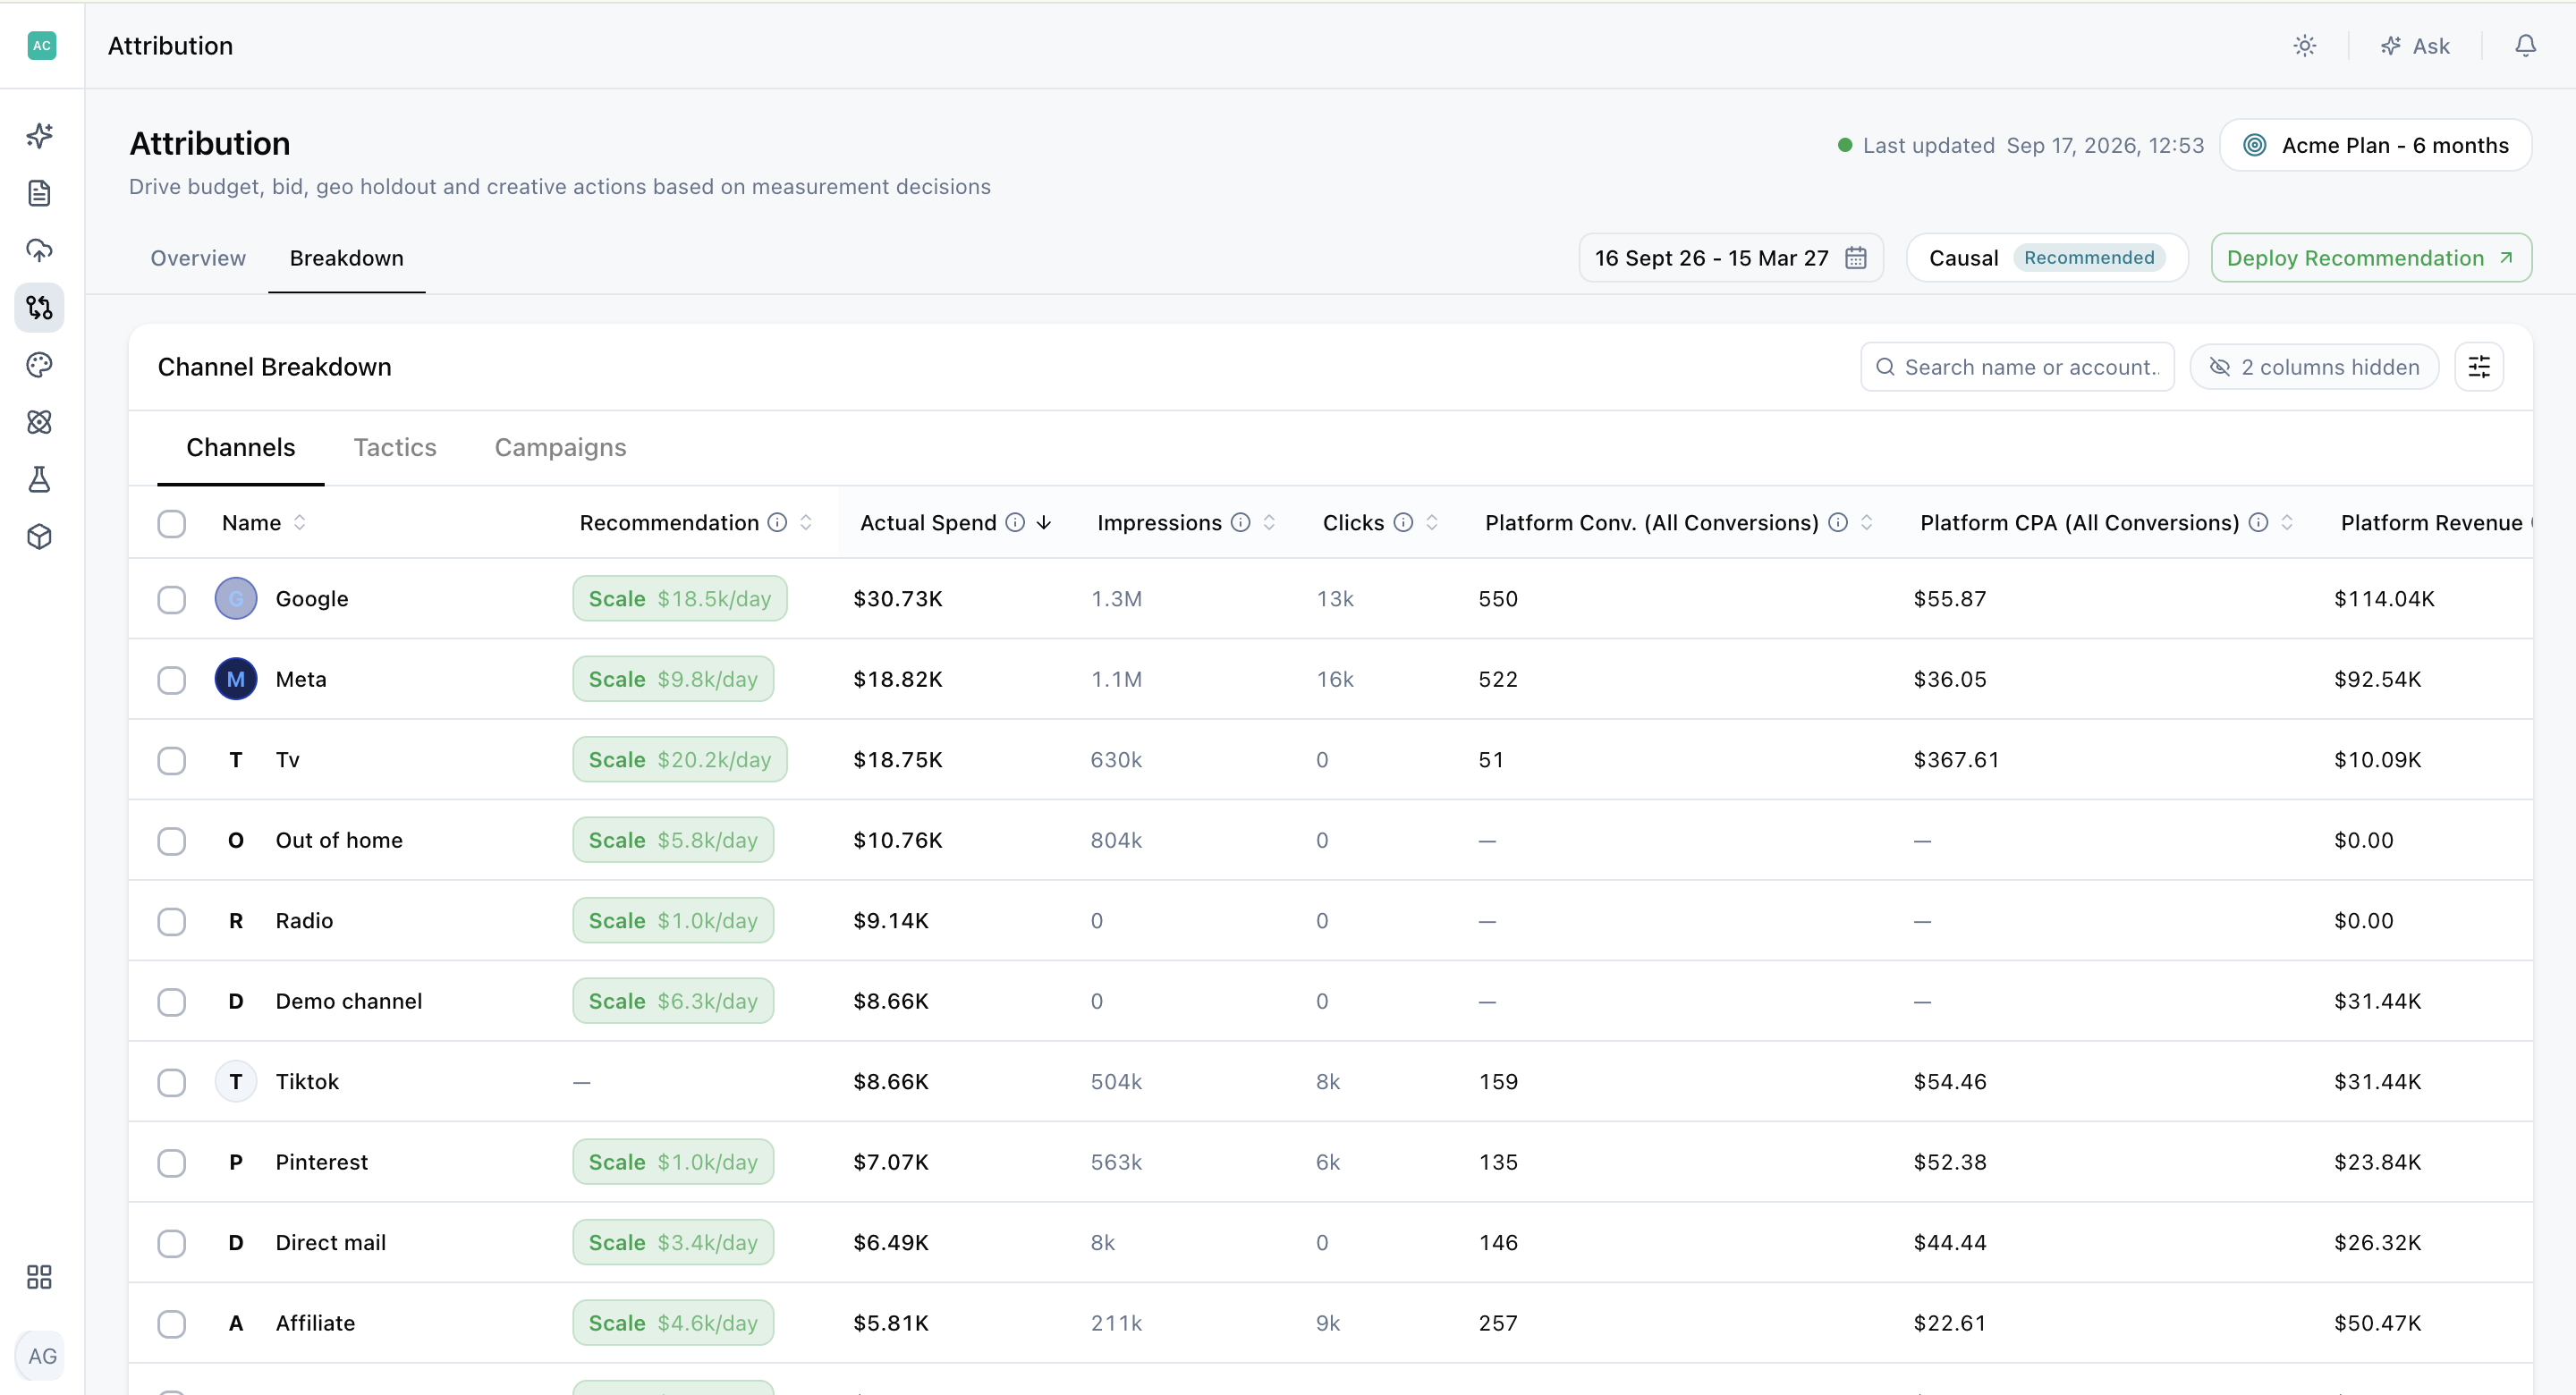
Drill down step by step
Work top down:
- Select one or more rows at the level you are on.
- Choose Drill into to carry that selection forward and filter the next level to only what you selected.
- Clear the selection to return to the full level.
This is the fastest path from a symptom to a cause. A channel with a weak incrementality factor rarely fails evenly. Drilling in usually shows a small number of retargeting campaigns pulling the whole channel down while prospecting holds up. Knowing that lets you fix the campaigns responsible rather than cutting the entire channel.
Shape the table to your question
Find an entity fast
Use search to jump straight to an entity by name or account when you already know what you are looking for.
Choose your columns
Select Choose columns to show, hide, and reorder metrics. Columns with no data or only zero values can be hidden automatically, which keeps the table readable when a level has partial coverage.
Common columns
- Recommendation and pacing: the action and the delivery status
- Actual spend, planned spend, and spend delta: how far off plan the entity is
- Impressions, clicks, and conversions: delivery volume
- Platform revenue and incremental revenue: side by side, so you can see how much reported revenue holds up
- Platform ROAS and iROAS: iROAS is incremental return on ad spend, or incremental revenue divided by spend
- Marginal ROAS: the return on the next dollar you add, rather than the average return across all spend to date
- Incrementality factor: the share of platform-reported revenue estimated to be incremental
- CPA: cost per acquisition
When to use Marginal ROAS
Marginal ROAS is the column to add when you are deciding where to put new budget. A campaign can hold a strong average iROAS while its marginal ROAS falls, which means it has saturated and extra spend will not return at the same rate. For example, a campaign with a 3x iROAS but a 1.2x marginal ROAS is still profitable overall, but the next dollar you add will earn far less than the dollars already spent.
Act on every entity
Each row carries a recommendation based on how its actual spend compares with the active target scenario (the media plan you've selected as your benchmark).
- Scale: for entities running under plan
- Maintain: for entities pacing near plan
- Reduce: for entities running over plan
Read recommendations alongside incrementality
Read these against incremental performance rather than on their own. A Scale flag on a campaign with a low incrementality factor means it is under-delivering on a plan it probably should not have had. The better move is to reallocate that budget to a campaign with a higher incrementality factor rather than push the weaker campaign back on track.
Check the weekly trend first
Select Weekly for any entity to open its week-by-week detail.
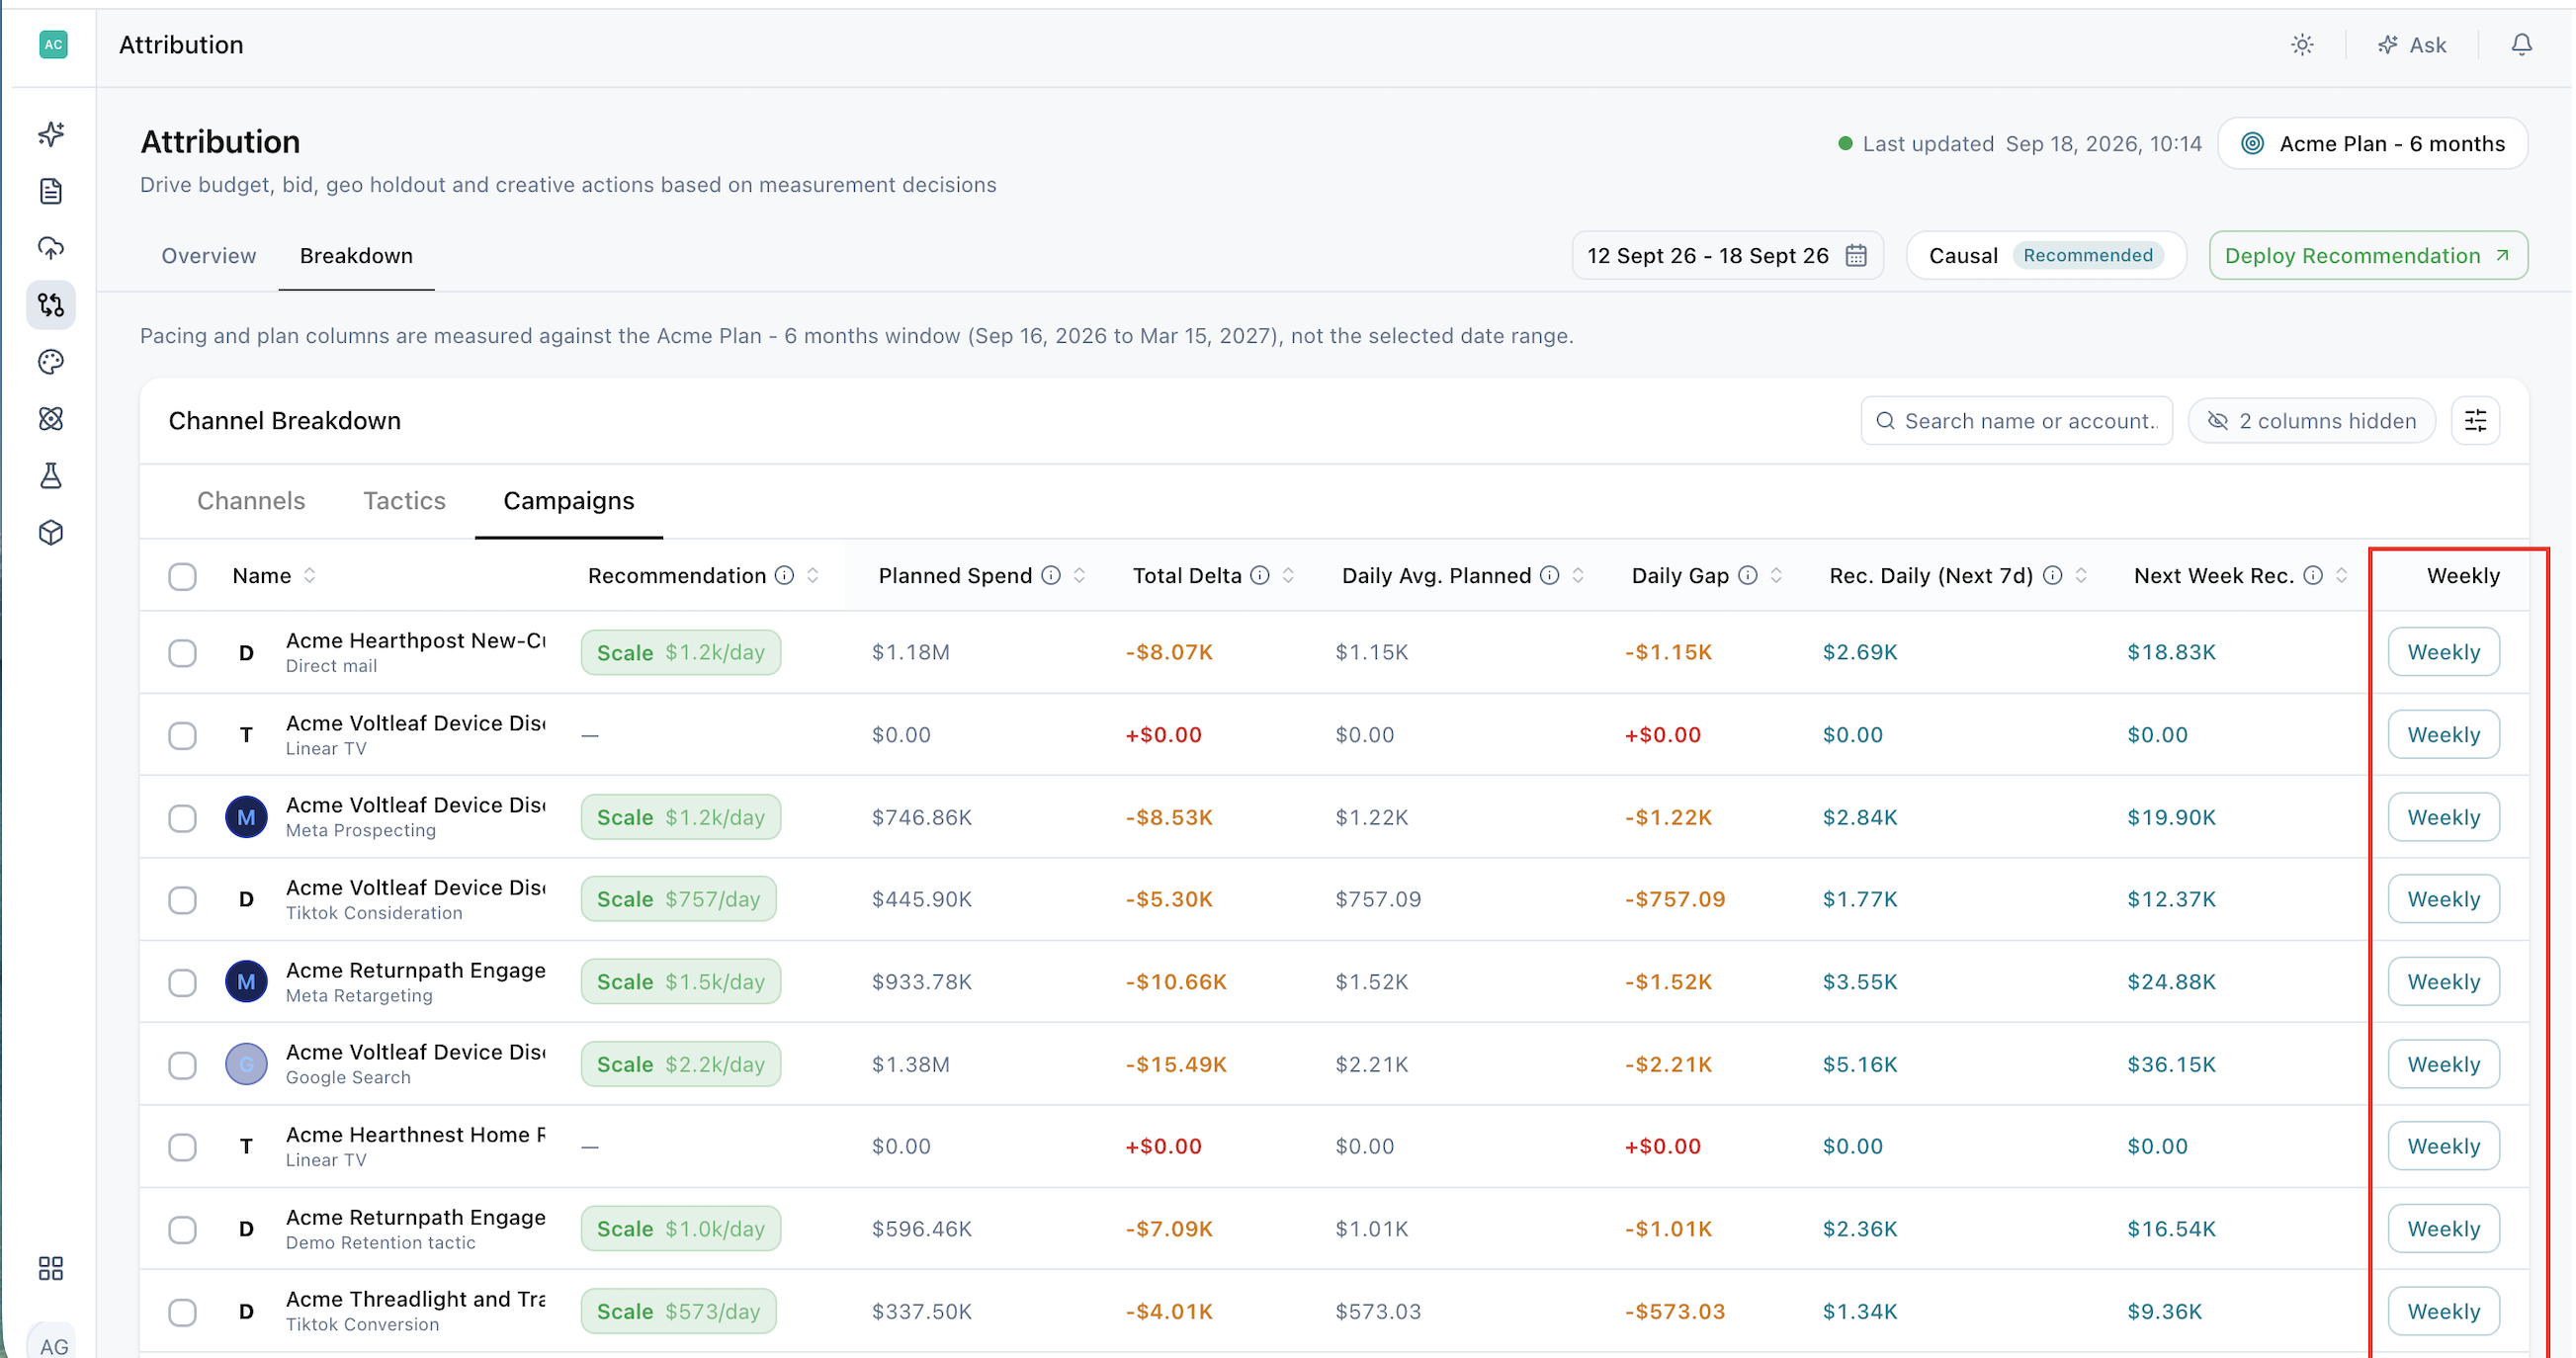
What you'll see
- Planned and actual spend by week: so you can see when the gap opened
- Pacing, plus weekly delta and cumulative delta: how far off plan each week was, and how the gap has built up over time
- Daily averages
- Recommended daily spend for the next seven days
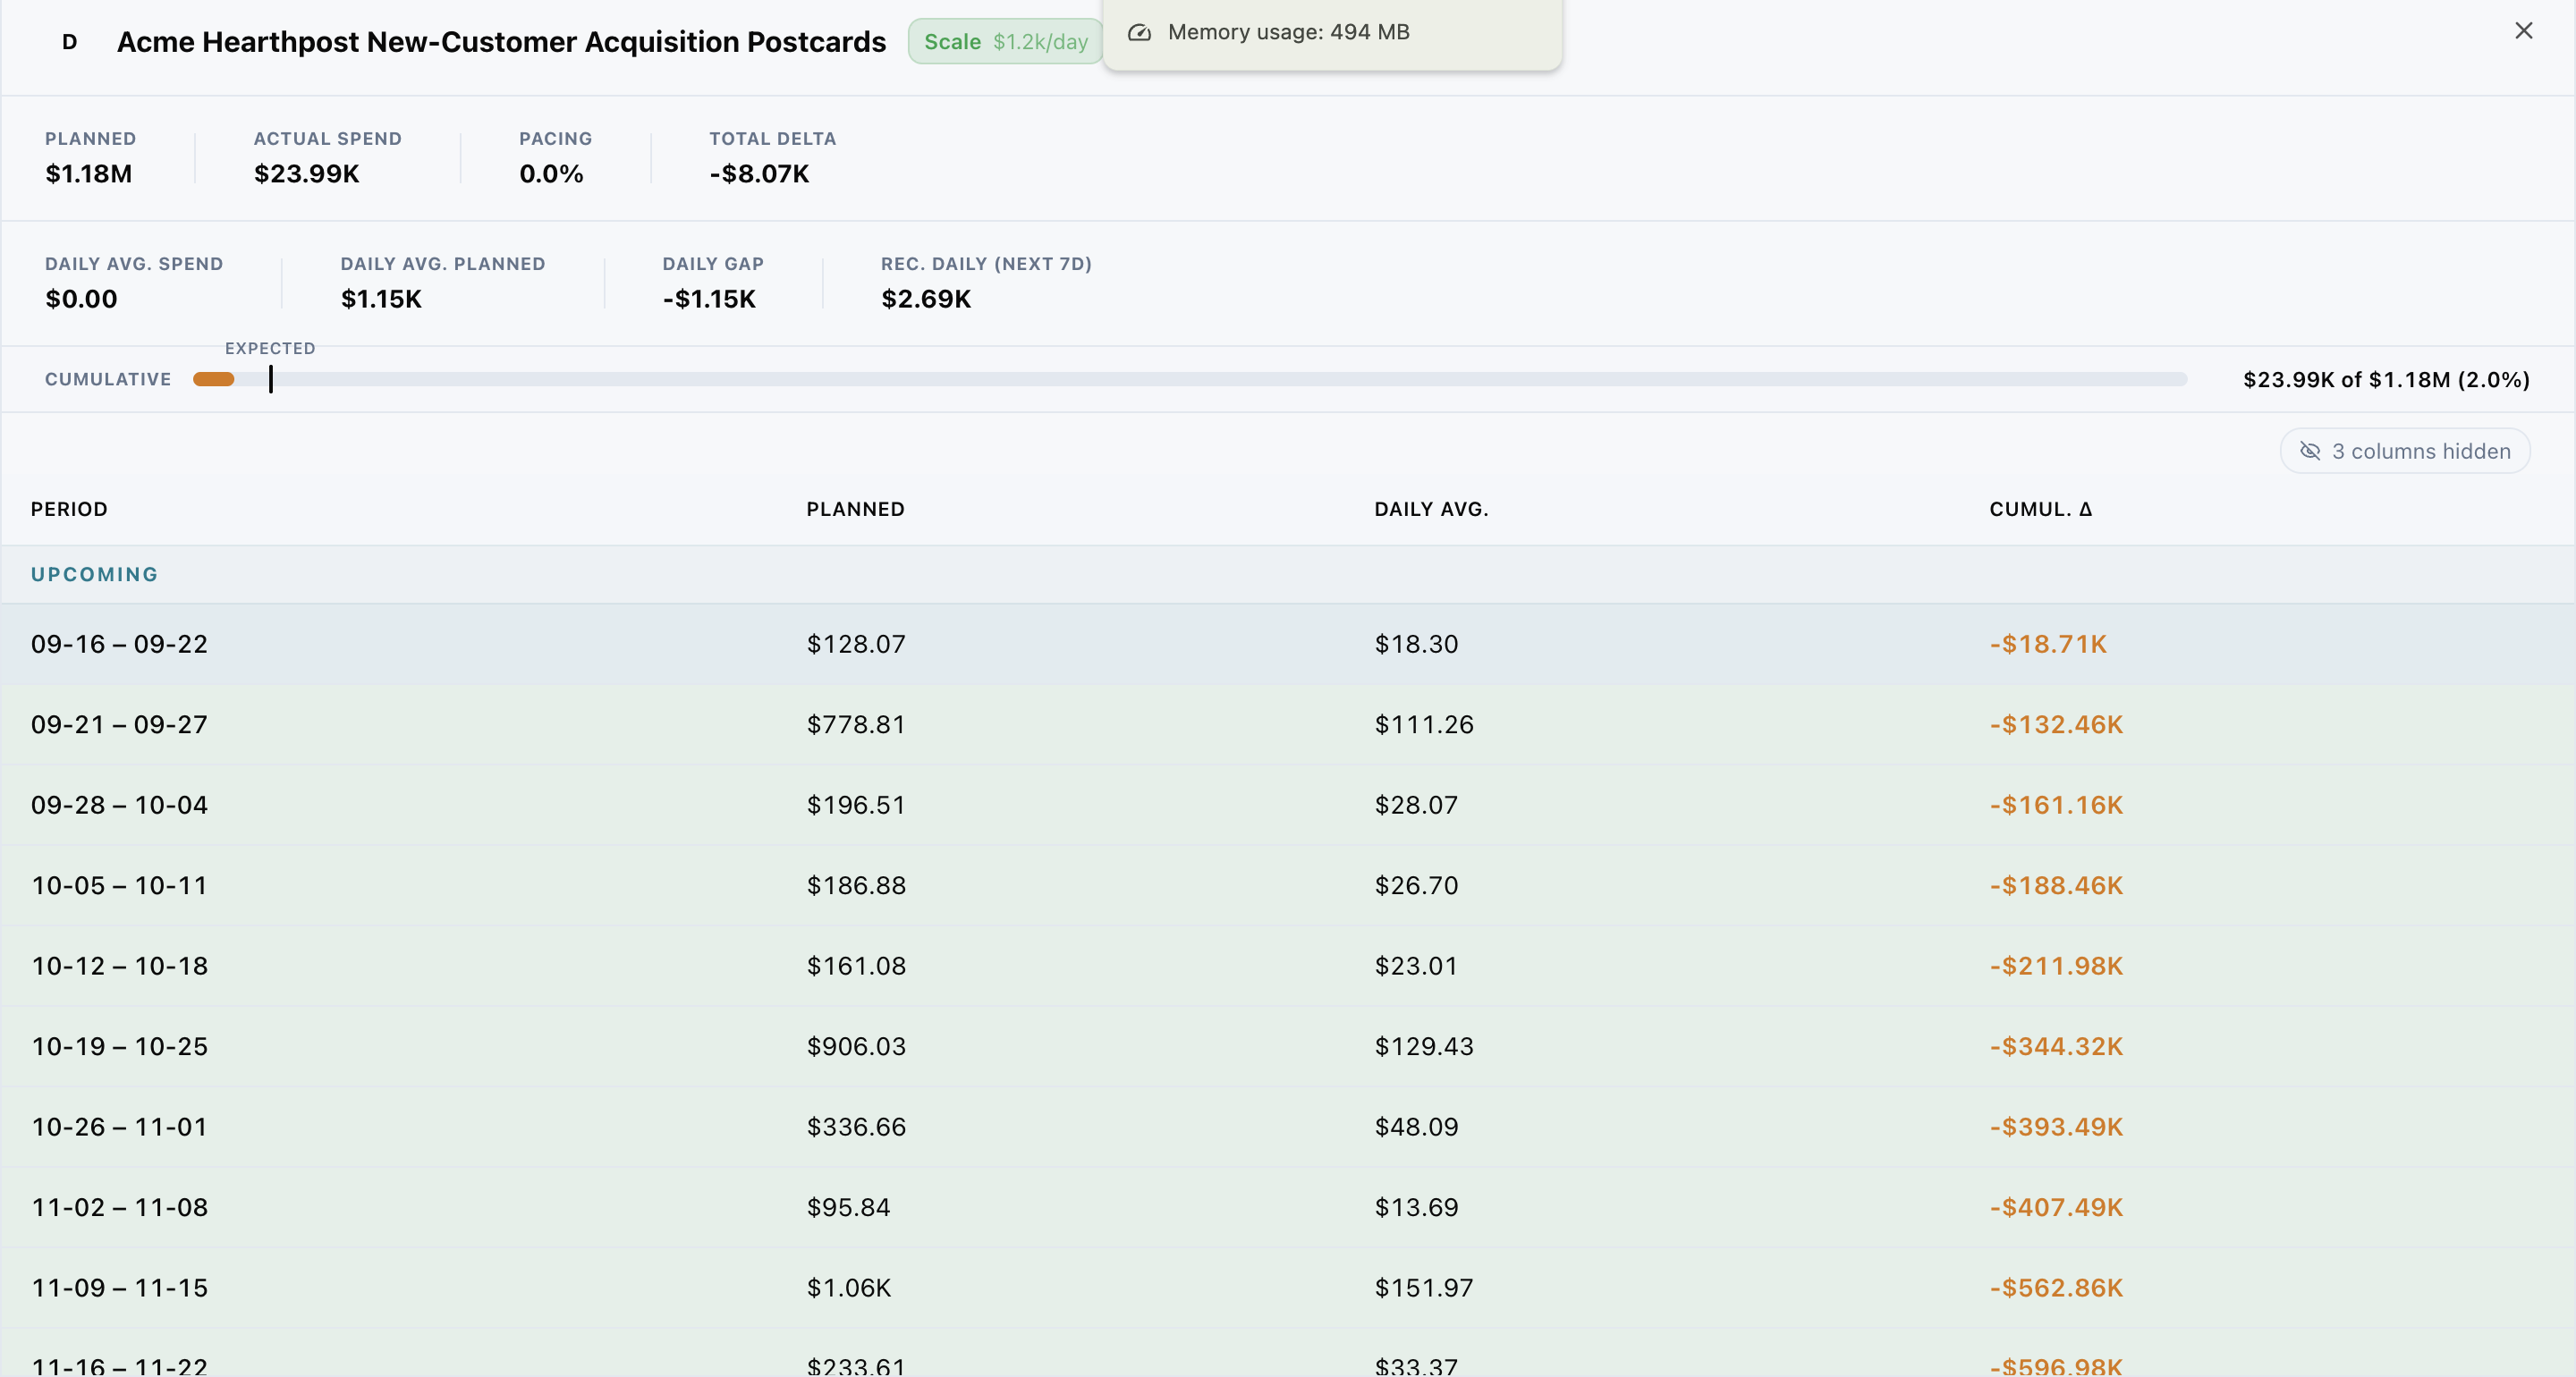
Separate a one-off from a trend
This is where you separate a one-off week from a sustained trend. A campaign that is 20% under plan because of a single paused week needs a different response than one that has drifted under every week since launch.
The recommended daily spend gives you a concrete number to take into the platform. It is sized to close the gap across the remainder of the scenario rather than all at once, so you avoid sudden spend spikes that can hurt delivery efficiency.
Frequently Asked Questions
Are the numbers in Breakdown platform-reported?
No. Every number is causal, reflecting what each line item actually contributed rather than the conversions each platform claimed.
Which levels can I break results down by?
Channels, tactics, campaigns, and ad sets. Each level appears only when there is data behind it.
How do I drill into a specific channel or campaign?
Select one or more rows, then choose Drill into to filter the next level to only what you selected. Clear the selection to return to the full level.
Why are some columns hidden?
Columns with no data or only zero values can be hidden automatically to keep the table readable. You can show, hide, and reorder columns from Choose columns.
What is the difference between iROAS and Marginal ROAS?
iROAS is the average incremental return across all spend to date. Marginal ROAS is the return on the next dollar you add. Use Marginal ROAS when deciding where to put new budget.
What does it mean if iROAS is strong but Marginal ROAS is falling?
The campaign has likely saturated. It is still performing well on average, but additional spend will not return at the same rate.
How are Scale, Maintain, and Reduce recommendations decided?
They are based on how an entity's actual spend compares with the active target scenario: Scale for under plan, Maintain for near plan, and Reduce for over plan.
Should I always follow a Scale recommendation?
Not on its own. Check the entity's incrementality factor first. If it's low, reallocating that budget elsewhere may be the better move.
What does the Weekly view show?
Planned and actual spend by week, pacing, weekly and cumulative delta, daily averages, and recommended daily spend for the next seven days.
How is recommended daily spend calculated?
It is sized to close the gap to plan across the remainder of the scenario, rather than all at once.
Updated about 3 hours ago