
Model Diagnostics
Interpret causal evidence and confidence signals in Marketing Mix Modeling.
Diagnostics shows you how much you can trust your model, so you can promote it, refine it, or retrain it with confidence. It helps you evaluate model fit, validation performance, channel transformations (how the model shapes each channel's response to spend over time), decomposition, and calibration evidence, all in one place.
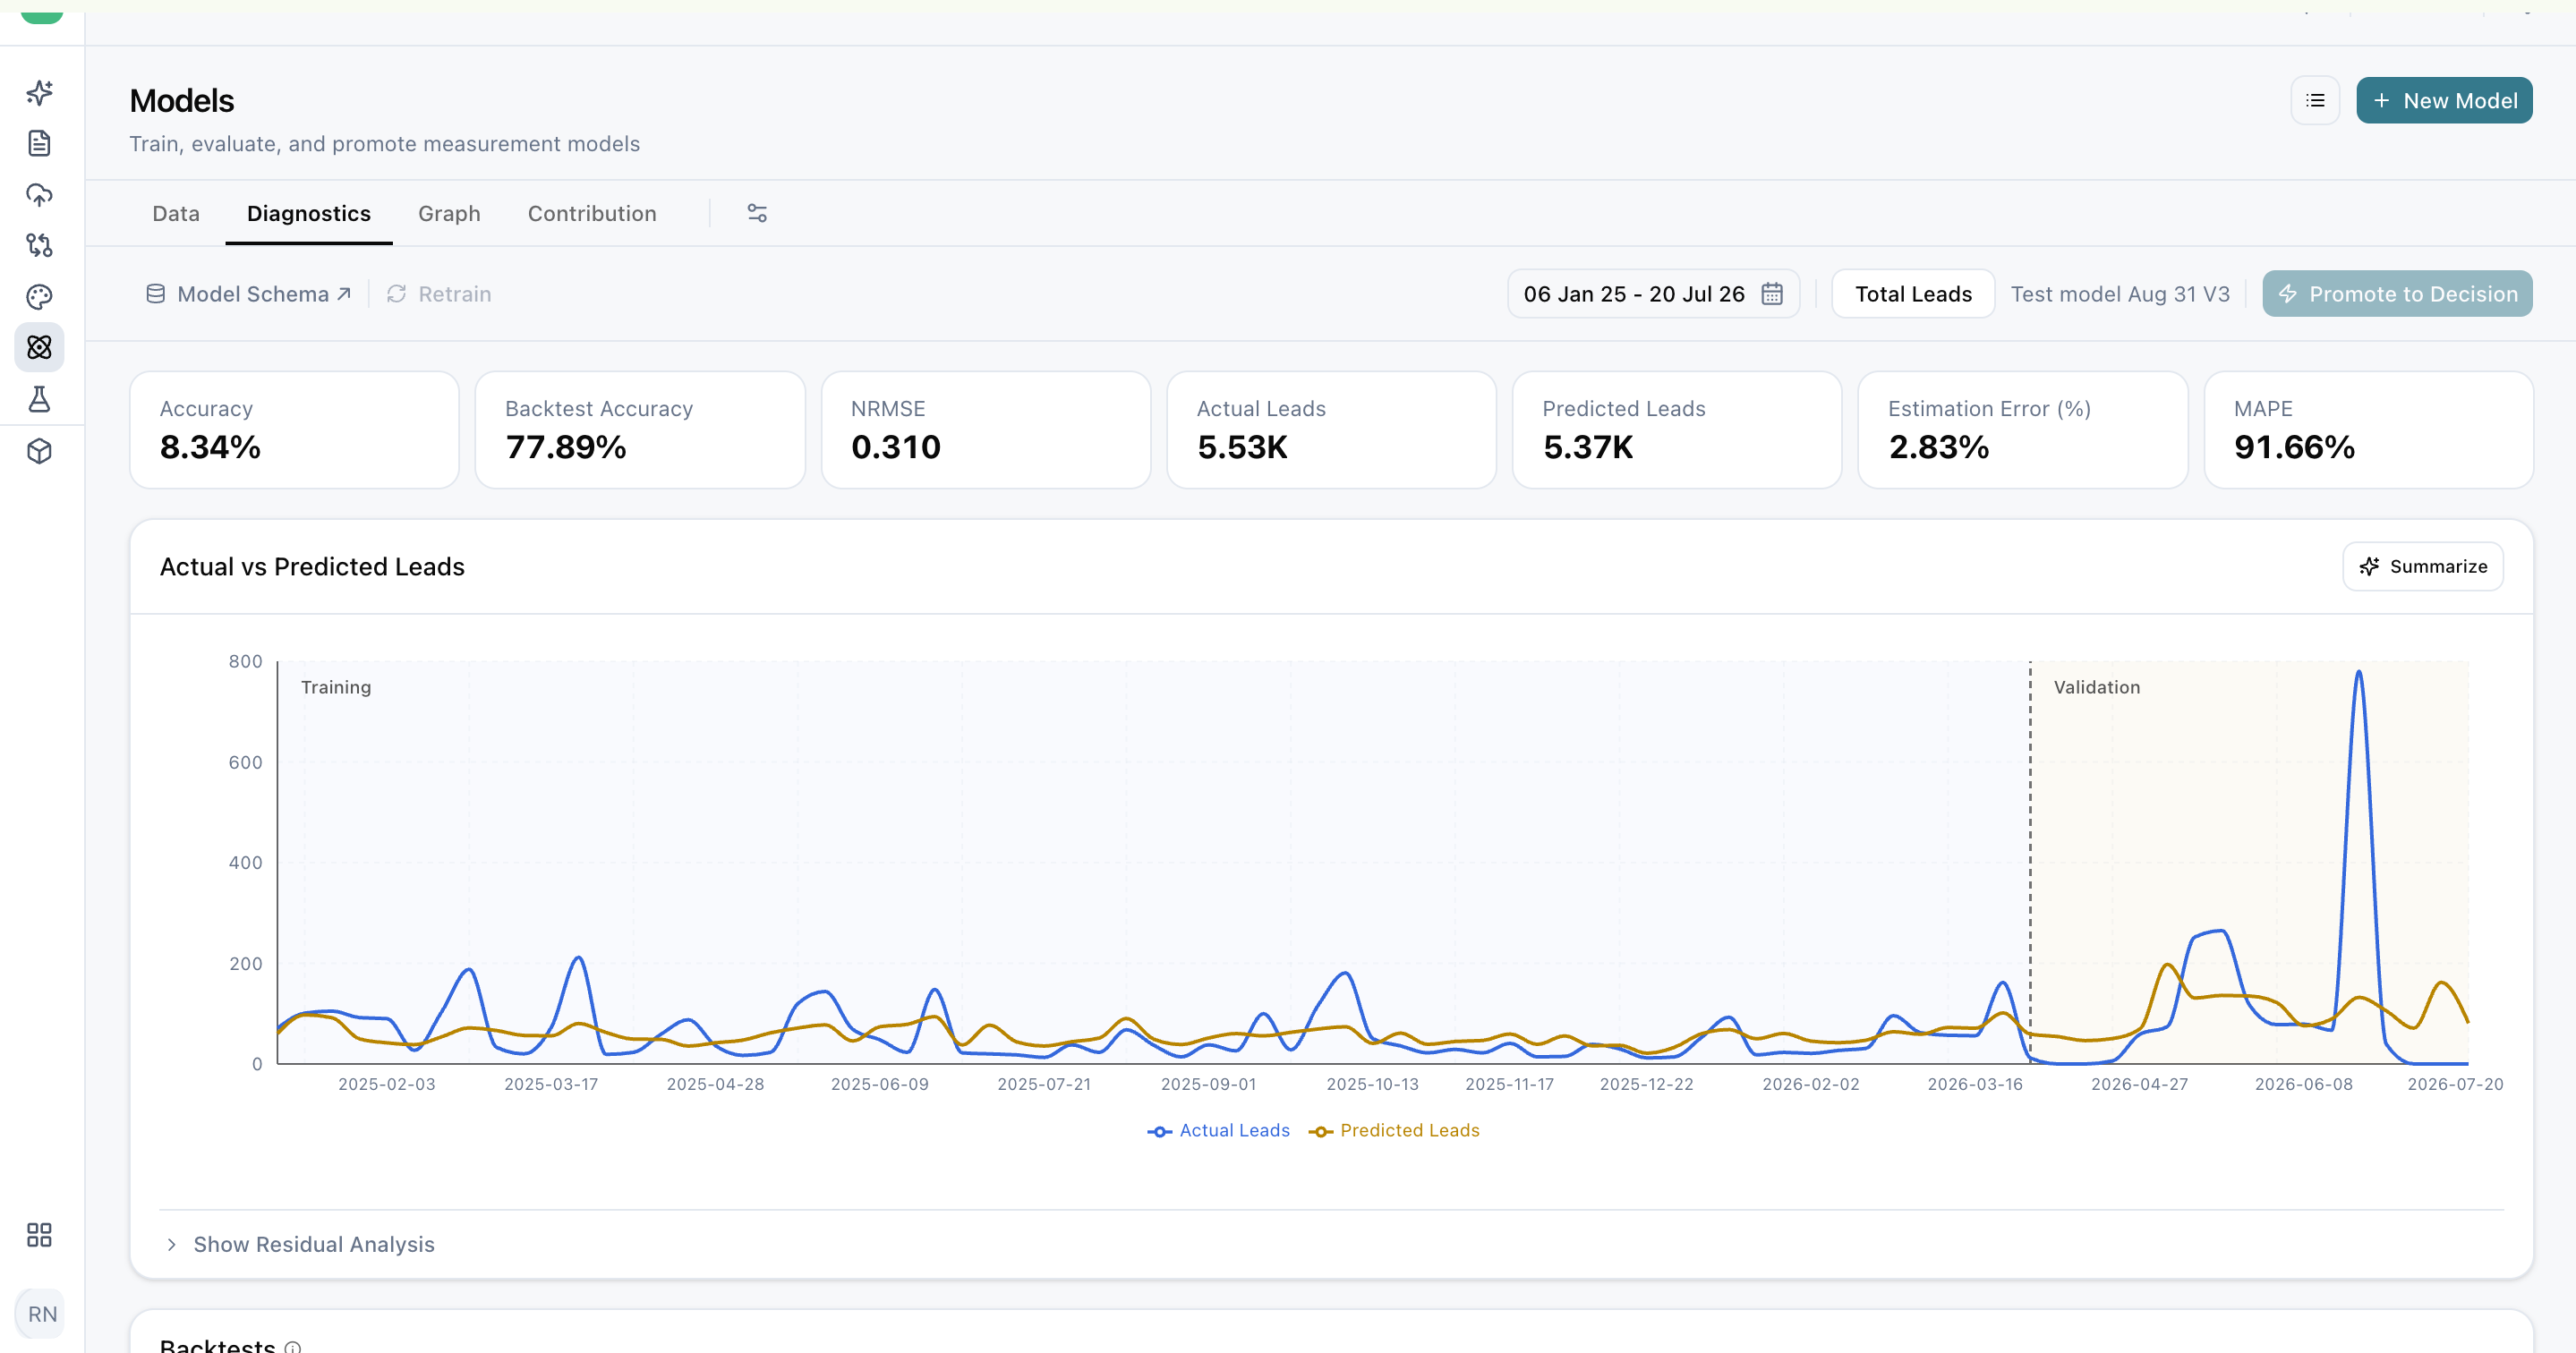
Check model quality at a glance
The headline metrics give you a quick read on how well your model fits your data and how well it predicts outcomes it hasn't seen.
Available metrics
Depending on your model, these can include Accuracy, Backtest Accuracy, NRMSE, actual outcome, predicted outcome, Estimation Error, and MAPE.
How to read them
Read these metrics together rather than in isolation:
- Accuracy: summarizes how closely the model follows the observed outcome in the fitted data (the data the model learned from).
- Backtest Accuracy: shows performance on the held-out portion of the data (data set aside and not used to build the model). This is the best indicator of how well the model will predict real-world results.
- NRMSE (normalized root mean squared error) and MAPE (mean absolute percentage error): describe prediction error. Lower values generally indicate a closer fit.
- Estimation Error: highlights aggregate bias between predicted and actual outcome, such as a model that consistently over- or under-predicts.
Avoid relying on a single threshold
Don't use any one metric threshold as the sole basis for a promotion decision. Compare training and backtest performance, then look at where errors occur. A model with slightly lower accuracy but consistent backtest results is often more reliable than one that fits the training data perfectly but predicts poorly.
Spot where the model misses
The actual versus predicted chart compares your observed outcome with the model's prediction over time, so you can see exactly when the model tracks reality and when it doesn't.
Use residuals to size the gap
Enable residuals (the difference between actual and predicted values) to see the size and direction of the gap at each point.
What error patterns can tell you
- Large errors around a specific event: errors concentrated around a launch, promotion, outage, or market event can indicate missing context. Adding that event to the model may improve it.
- Repeated patterns in residuals: a recurring pattern can indicate that the model hasn't captured a systematic effect, such as a weekly or seasonal cycle.
Confirm the model predicts well
The backtest table summarizes performance on data that was not used to fit the model. This tells you whether the model has learned real relationships or simply memorized the training data.
Similar training and backtest performance is stronger evidence of generalization (the model's ability to predict well on new data) than a strong fitted result with weak backtesting.
Understand how each channel responds
The saturation, Adstock, and time-to-conversion views show how the model has learned each channel's behavior, so you can check whether it reflects how your channels really work.
- Saturation: shows how response changes as investment increases, including the point where additional spend starts returning less.
- Adstock: shows how media impact decays after exposure. For example, a TV ad may keep influencing purchases for weeks after it airs.
- Time to Conversion: separates immediate impact from later carryover (the effect that continues after the initial exposure).
- Immediate and Carryover: summarizes that split for the available channels.
Review whether the shapes and timing are plausible for each channel and its buying strategy. For example, a search channel that shows a long, slow carryover may be worth a closer look, since search typically converts quickly.
Check results against your business
Decomposition separates the predicted outcome into modeled components over time: media, baseline, trend, seasonal, and contextual movement. Use it to check whether each component aligns with known business conditions, such as seasonal peaks appearing in the right months or media contribution rising during major campaigns.
Review your experiment evidence
The calibration summary displays the experiment evidence (results from incrementality tests, such as geo experiments, used to anchor the model to real-world outcomes) supplied during model creation or retraining.
What to review
Review each of the following alongside the model estimate:
- Channel
- Experiment period
- Incremental efficiency
- Confidence
Close alignment between the experiment result and the model estimate is a strong sign the model reflects reality. A large gap is worth investigating before you promote the model.
Frequently Asked Questions
Which metric matters most when deciding whether to promote a model?
No single metric should decide promotion. Read the metrics together, compare training and backtest performance, and look at where errors occur.
What is the difference between Accuracy and Backtest Accuracy?
Accuracy shows how closely the model follows the data it was trained on. Backtest Accuracy shows how well it predicts held-out data it hasn't seen, which is a better indicator of real-world reliability.
Are lower NRMSE and MAPE values better?
Yes. Both describe prediction error, and lower values generally indicate a closer fit.
What does Estimation Error tell me?
It highlights aggregate bias between predicted and actual outcome, such as a model that consistently over- or under-predicts.
What are residuals, and why should I enable them?
Residuals are the gap between actual and predicted values. Enabling them shows the size and direction of that gap at each point, making it easier to spot where and why the model misses.
What should I do if errors cluster around a specific event?
Errors around a launch, promotion, outage, or market event can indicate missing context. Consider whether that event should be represented in the model.
What if training accuracy is high but backtest accuracy is low?
This suggests the model may not generalize well to new data. Similar training and backtest performance is stronger evidence of a reliable model.
How do I know if a channel's saturation or Adstock curve is right?
Check whether the shape and timing are plausible for the channel and its buying strategy. Curves that don't match how a channel typically behaves are worth investigating.
Where does the calibration evidence come from?
It is the experiment evidence supplied during model creation or retraining. To add or update it, retrain the model.
What should I do if the calibration evidence and the model estimate don't match?
Investigate the gap before promoting the model. Review the experiment period, confidence, and incremental efficiency alongside the model estimate to understand the difference.
Related Articles
Updated about 1 hour ago