
Data Transformation
Data Transformation gives every number one meaning, so your models and reports stop arguing about what spend is.
Data Transformation makes sure data from every platform means the same thing in Lifesight, so your reports and models compare like with like. Every platform names things its own way. Google Ads reports a column called spend. Meta reports a spend column too, plus an attributed_revenue column that counts conversions over a different window. The sheet from finance calls the same idea Media Investment. That's three names for one number, and no way to add them up.
Data Transformation is where you settle that. For each column in your source, you define what it means in Lifesight terms. Once you do, everything downstream uses one shared vocabulary.
Understand the two things you're connecting
A source column is what the platform gives you. It has whatever name the platform chose and holds whatever the platform put in it. You don't control this.
A Lifesight field is the shared name that Lifesight and your models use, such as Spend, Impressions, Clicks, Revenue, Date, or Country. You do control this, and it's the same everywhere.
Data Transformation is all about connecting the two.
See the status of every connected source at a glance
When you open Data Transformation, you'll see one row for each connected source.
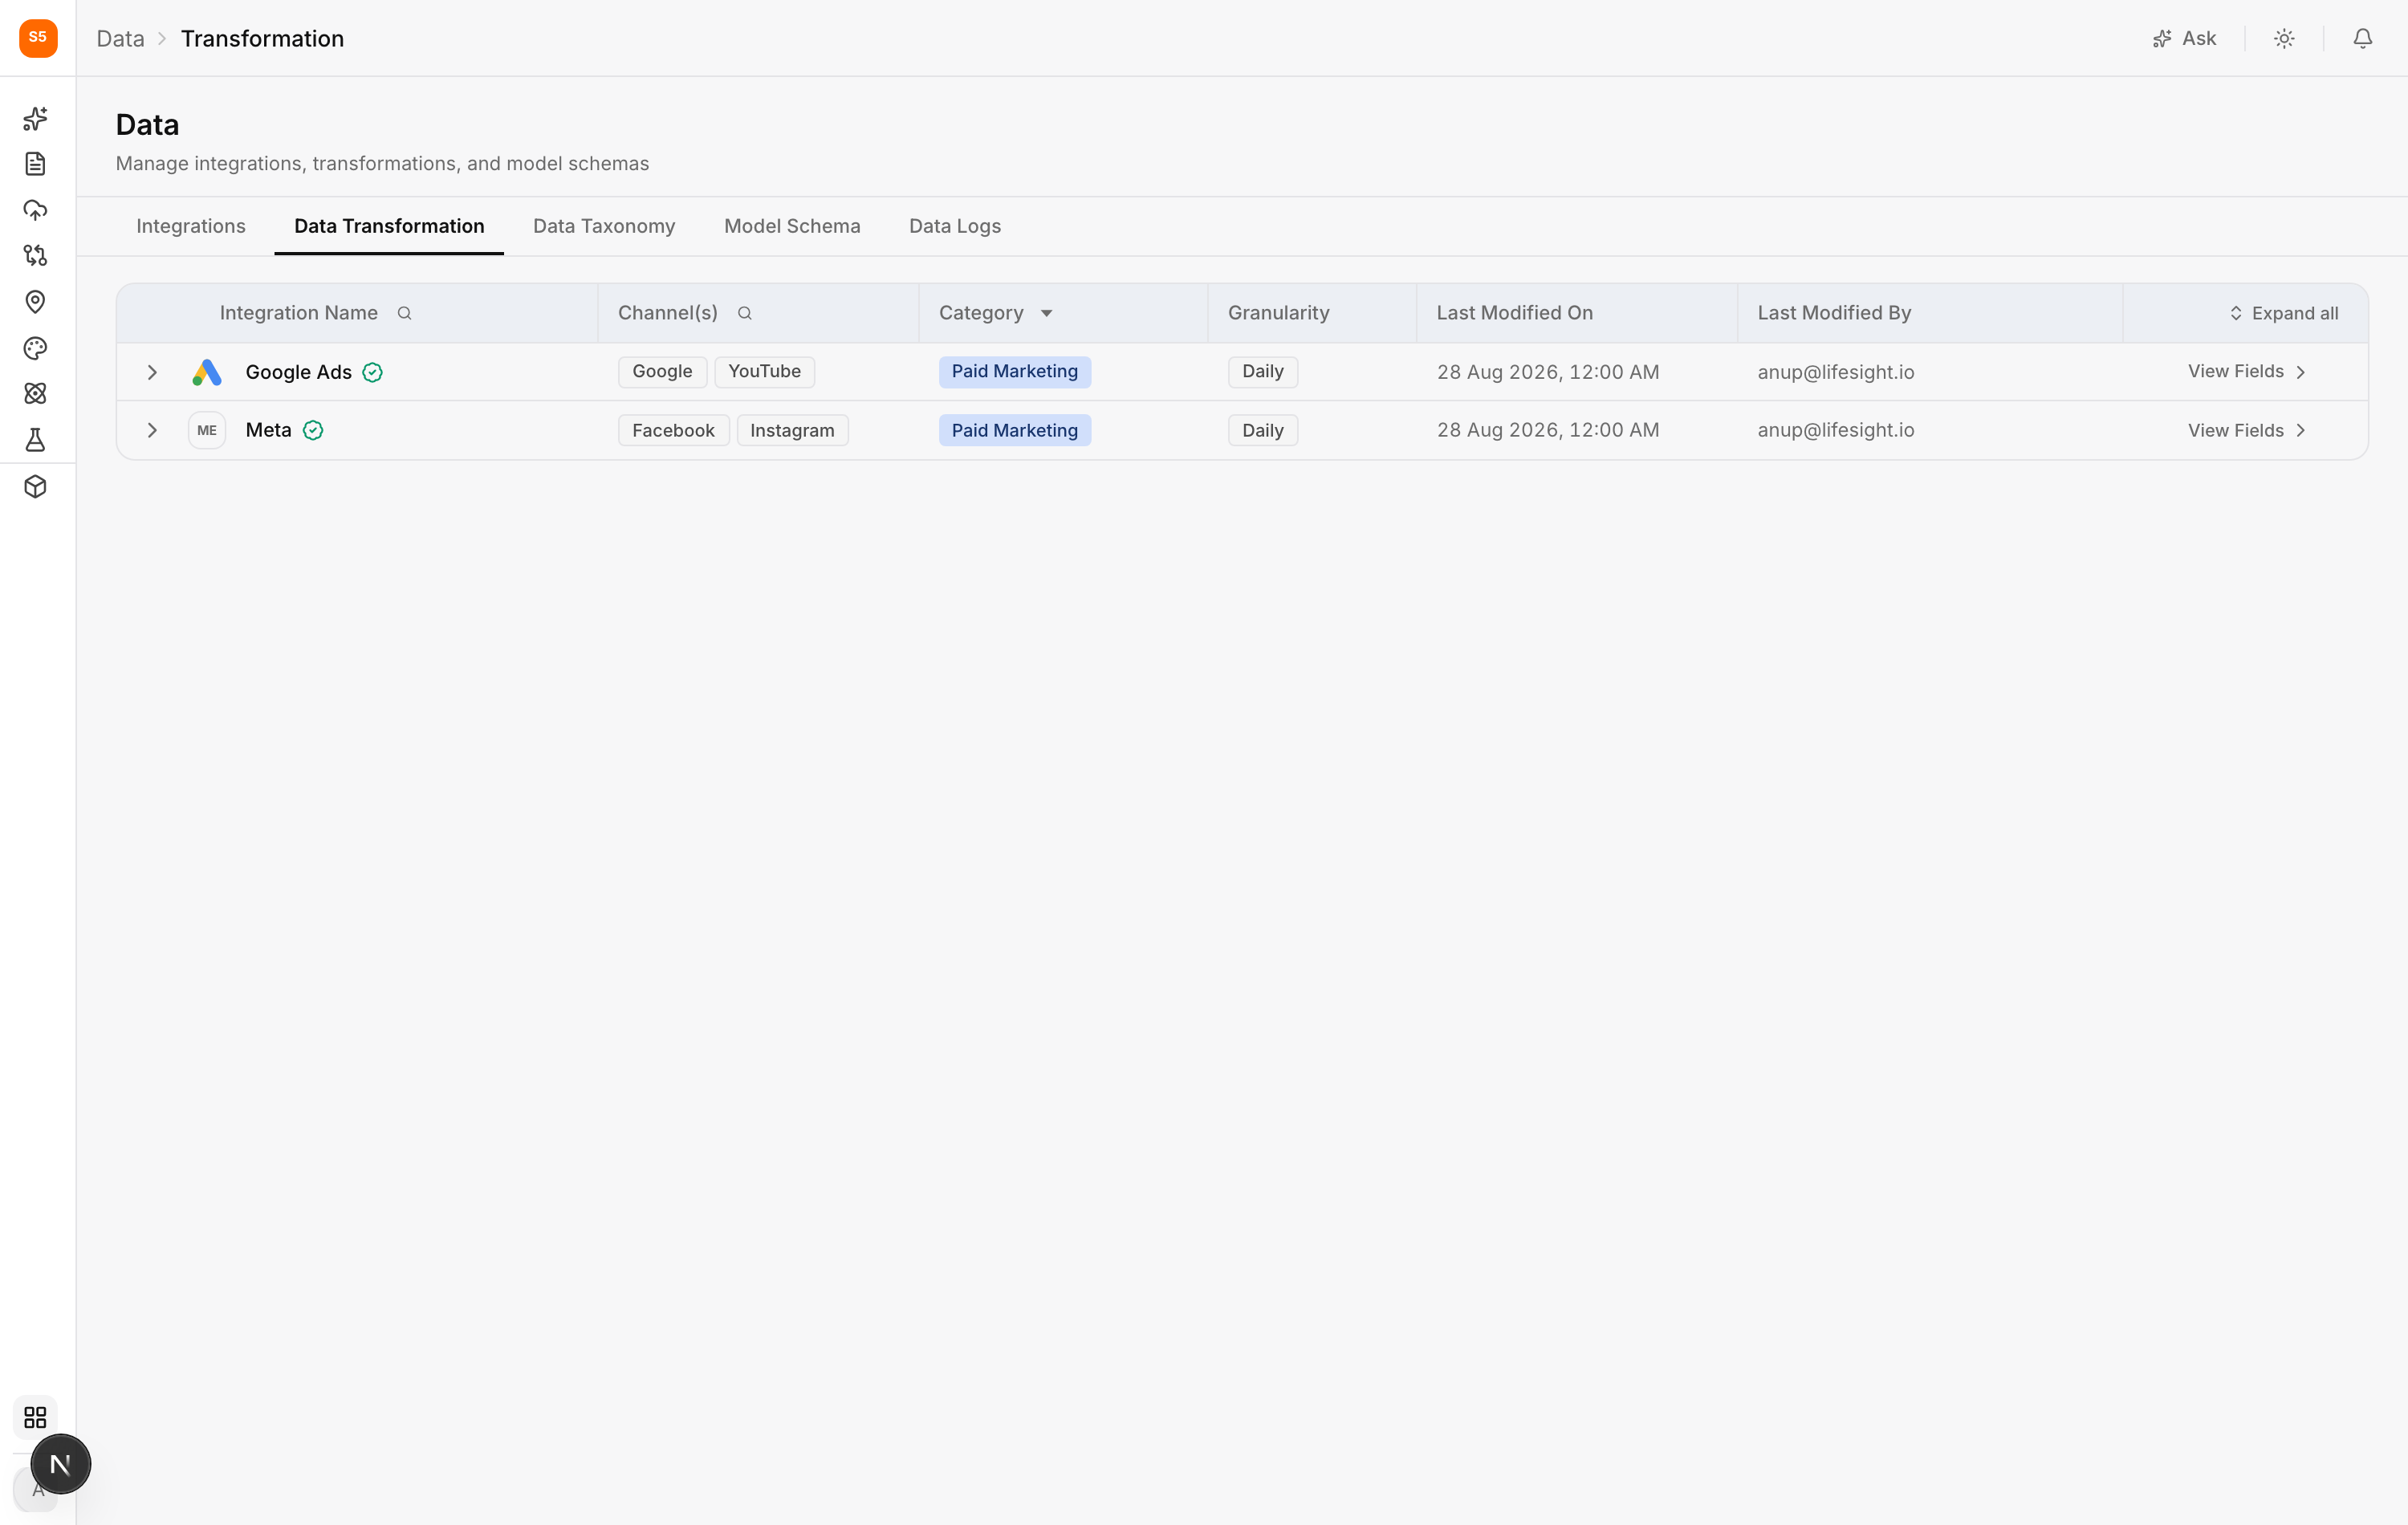
| Column | What it means |
|---|---|
| Integration Name | The source. A green check mark means its mandatory fields are mapped and ready to use. |
| Channel(s) | The channels this source feeds. Google Ads, for example, carries both Google and YouTube. |
| Category | The data category the source belongs to. This decides which Lifesight fields are offered when you map its columns. |
| Granularity | How finely the data is reported over time (for example, daily). Most ad platforms report daily. |
| Last Modified On and Last Modified By | Who last changed the mapping, and when. Useful when a number changes and nobody knows why. |
Click View Fields on a row to open that source's fields.
See only the fields that make sense for each source
Every source belongs to a data category, and the category decides which Lifesight fields make sense for its columns. This is why you won't be offered Impressions when mapping a column from an accounting export.
| Category | What belongs here |
|---|---|
| KPIs | The outcomes you care about: revenue, conversions, orders, installs. |
| Paid Marketing | Spend, impressions, clicks, and other ad metrics, grouped by ad platform. |
| Organic | Owned and earned signals, such as email sends or organic sessions. |
| Contextual | Factors that explain the world around your marketing: seasonality, holidays, promotions, weather. |
| Others | Anything not yet categorized. |
Set up each field correctly in the field workshop
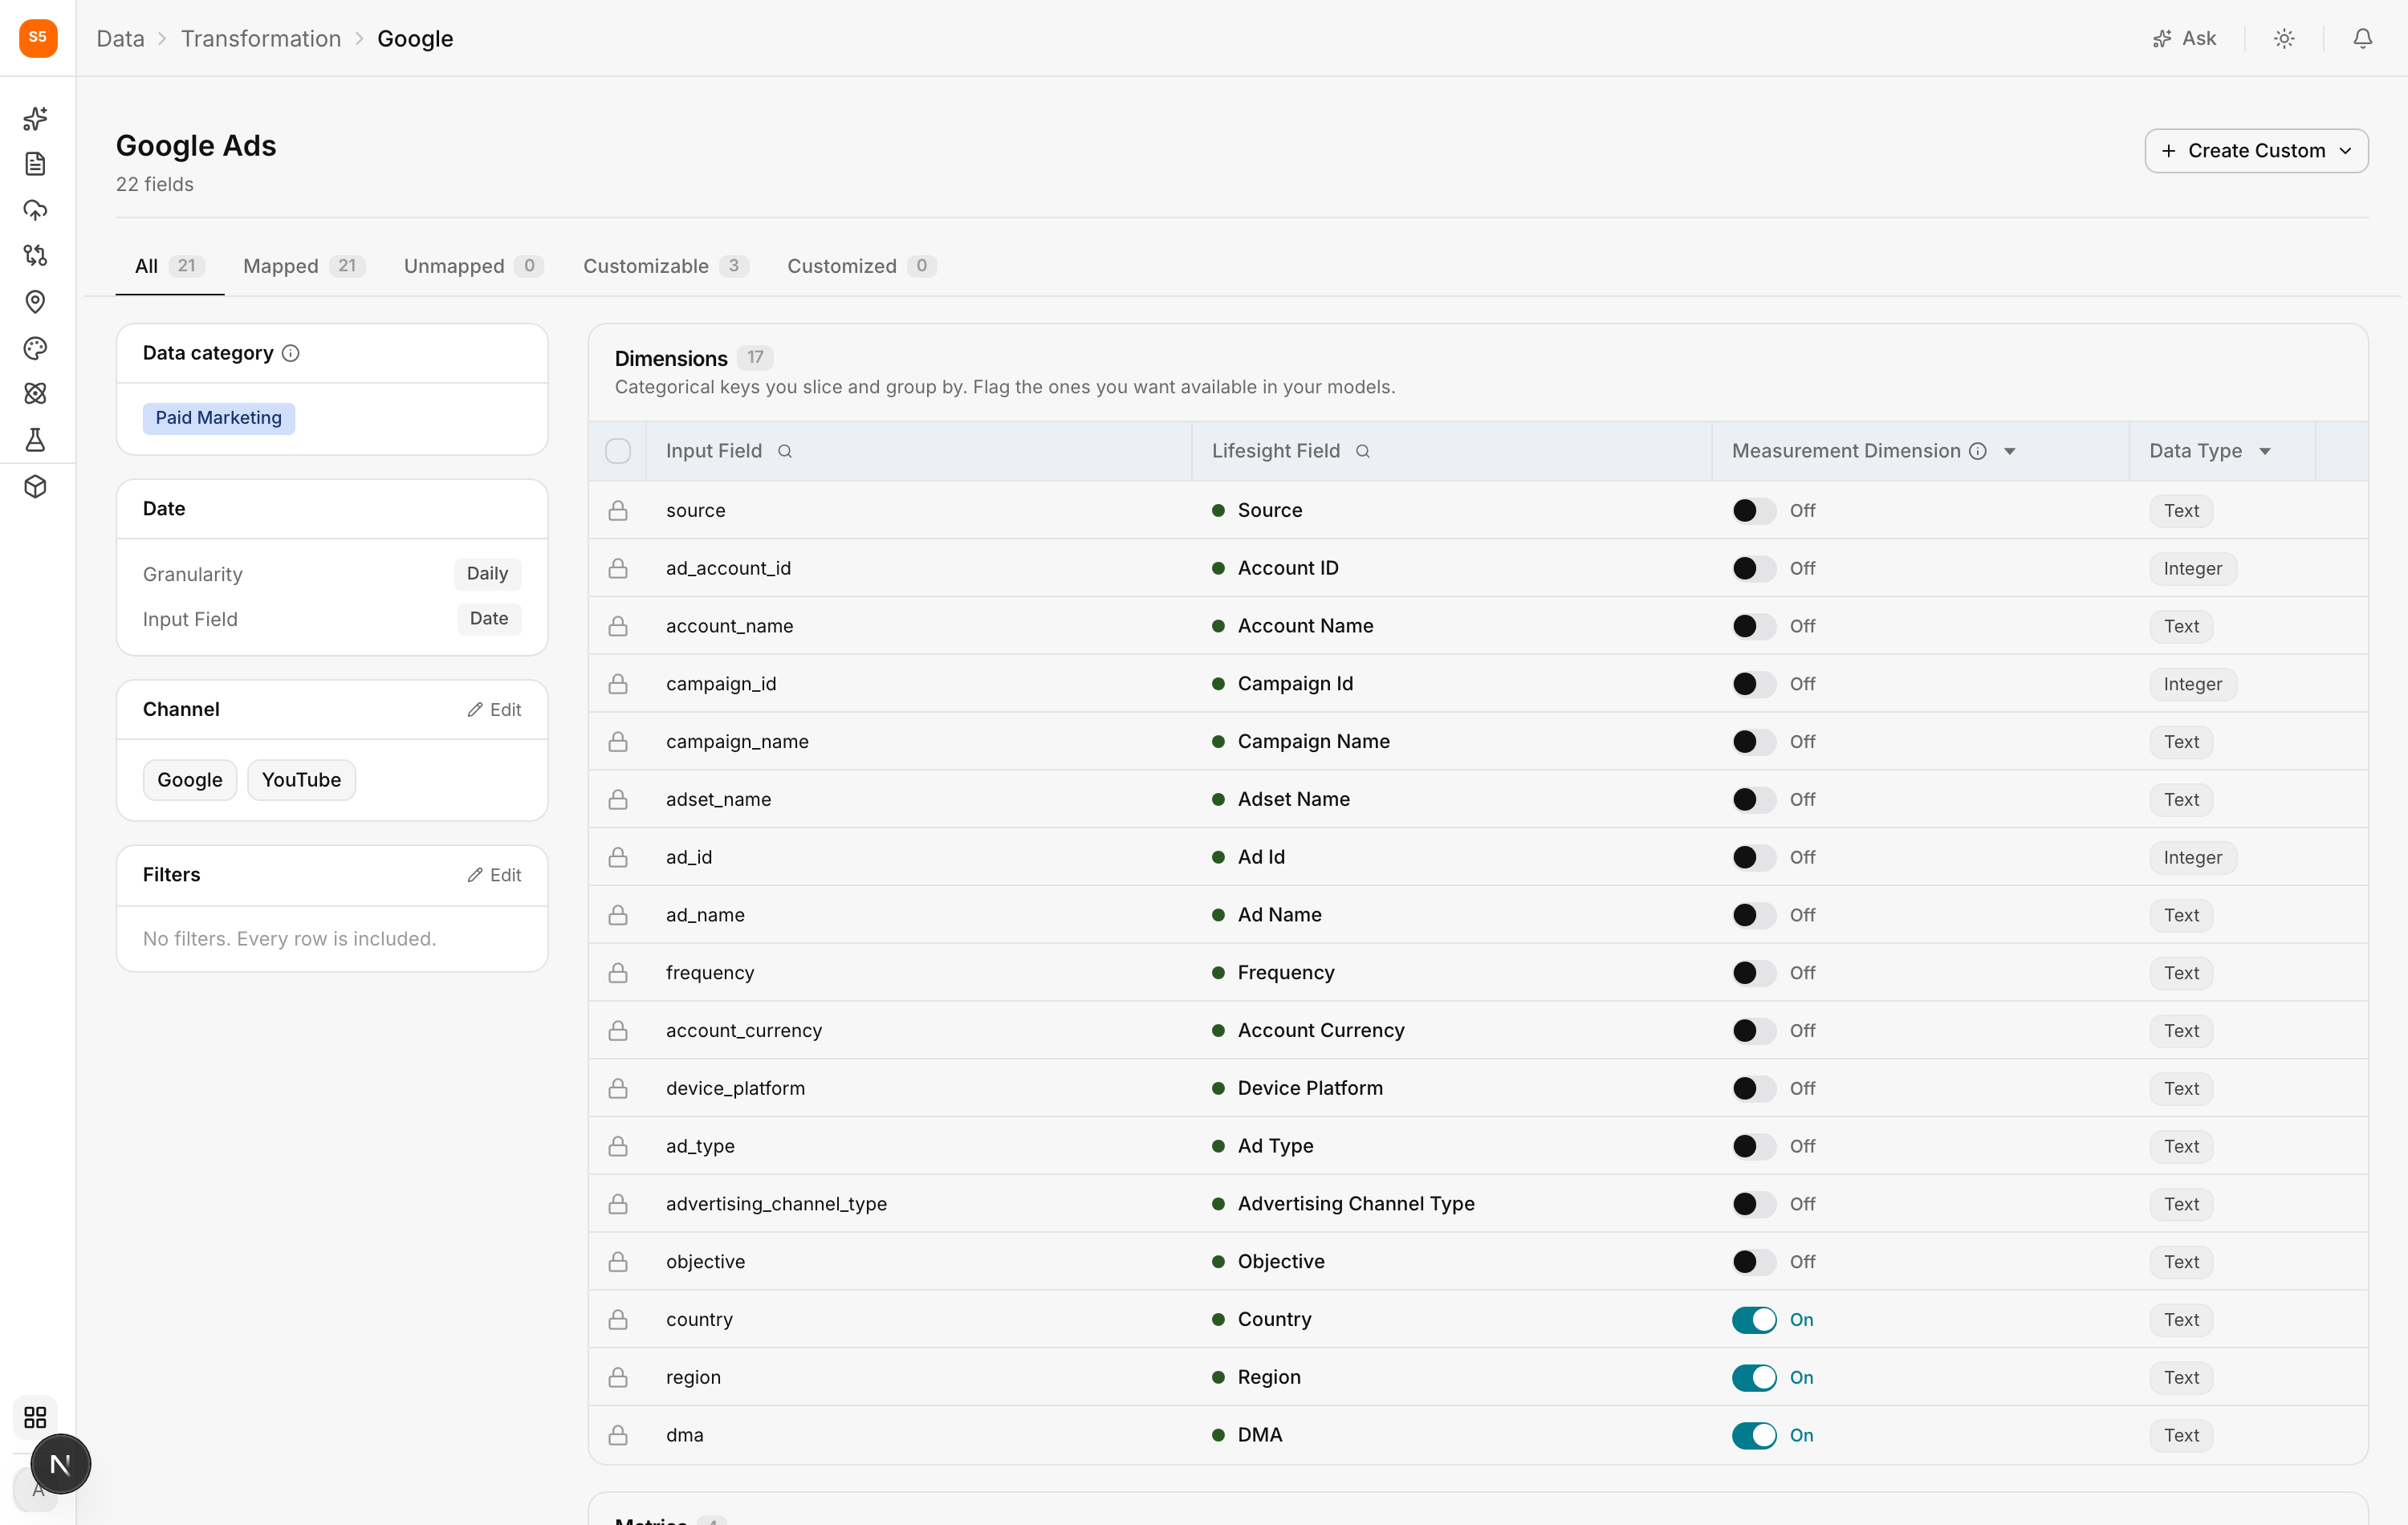
Inside a source, its columns are sorted into two groups, because models treat them very differently.
Dimensions and metrics
Every column has one of two roles, and the role decides what Lifesight can do with it.
A dimension describes a row. For example, Country, Campaign Name, Device, Objective, or Date. Dimensions are what you group by, filter by, and split by. You never add them up. Adding two country names together is meaningless, which is why they're kept separate from metrics.
A metric measures a row. For example, Spend, Clicks, Impressions, or Attributed Revenue. Metrics are numbers that can be combined, and every metric has a roll-up (the rule for combining values across rows) that says how.
The roll-up matters more than it looks. When Lifesight combines 30 daily rows into one monthly number, the roll-up decides the answer:
- Sum for anything that accumulates, such as spend, clicks, and impressions
- Average for a rate or a ratio
- Min, Max, or Count for less common cases
Summing a percentage is the classic mistake. Adding 30 daily click-through rates together produces a number that means nothing, so a rate should use Average instead of Sum.
If a column is in the wrong group, open its actions menu and select Make Dimension or Make Metric. This only changes how the column is displayed and modeled. It doesn't change the underlying data.
Data types
Each field also has a data type, which defines what kind of values it holds. For standard Lifesight fields, the type is set by the field itself, so you rarely need to change it. You'll mainly see it on custom fields and when checking that a column arrived correctly.
| Type | What it holds |
|---|---|
| Text | Any string. The default for names and labels. |
| Integer | A whole number, such as clicks or impressions. |
| Decimal | A number with a fractional part. |
| Number | A precise decimal, used where exactness matters. |
| Big Number | A number too large for the standard numeric range. |
| Currency | A monetary amount. |
| Percentage | A rate, stored so it reads as a percentage. |
| Boolean | True or false. Useful for flags, such as whether a promotion ran. |
| Date | A calendar date, formatted YYYY-MM-DD. |
| Date and time | A date with a time, formatted YYYY-MM-DD HH:MM:SS. |
| JSON | Structured data kept as is. |
The two date formats are worth remembering, because unclear dates are the most common import problem. 03/04/2025 could mean March or April depending on who wrote it, while 2025-04-03 can't be misread.
Measurement dimensions
Some dimensions are only descriptive. Others are ones you want to measure results by, and those need to be marked.
A measurement dimension is a dimension you've flagged so models and taxonomy can use it. Turn it on using the toggle in the dimension's row.
Flagging a dimension does two things:
- It appears under Your dimensions when you build a data model. This makes it available for dimensional or hierarchical models, which calculate separate results for each country, brand, or product line.
- It carries through to Data Taxonomy, where it becomes available as a column and as a field you can write rules against.
Be selective. Country, brand, region, and product line are usually worth flagging because you genuinely want to model or classify by them. Ad ID usually isn't, since nobody models by individual ad, and flagging everything makes the model builder and rules editor harder to use.
To change a field, open the actions menu at the end of its row and select Edit.
Map a source so every column lands in the right channel
Before you map individual columns, you need to describe the source as a whole. The left rail of a source's page summarizes the row contract (the shape of one row of this data):
- Data category, which decides which Lifesight fields are offered for its columns
- Date, the date column and its granularity, taken from how the integration was set up
- Channel, how this data maps to a channel Lifesight recognizes
Channel is the entry you may need to set, and it matters because everything downstream groups data by channel, not by the file name. A file called Q4_partner_export.csv means nothing to a model. Knowing that its spend is Paid Social does.
Native connectors already know their channel, so Google Ads arrives carrying Google and YouTube automatically. Uploaded files don't, so this step is mainly for CSV and spreadsheet sources.
When you open Channel, you'll be asked how your data is shaped. There are three options, and picking the right one is the whole task.
| Shape | What it looks like | What you do |
|---|---|---|
| One channel per column | Each column is a channel: DATE, EMAIL_SPEND, OBA_SPEND, INKPACT_SPEND | Assign a channel to each column |
| A column holds the channel | One column names the channel on each row: date, channel, spend with values like fb and google | Pick that column, then map each value to a channel |
| The whole file is one channel | No channel column, because every row belongs to the same channel | Confirm the single channel for the source |
For the second shape, Lifesight suggests matches for common abbreviations, so fb suggests Facebook Ads and bing suggests Microsoft Ads. Review the suggestions instead of accepting them automatically, because in-house shorthand is rarely as obvious as it seems to the person who created it.
Getting this right once means every column underneath is automatically assigned to the correct channel, which is why it comes before column mapping.
Choose how each field gets its value
When you edit a field, the section called How this field gets its value offers two options. Which one you need depends on whether the value changes from row to row.
| Use case | Choose | Read more |
|---|---|---|
| The source reports the value, and it changes from row to row | A field from this source | Map a field from a source |
| The value is the same on every row from this source | A fixed value for every row | Set a fixed value for a source |
Before either of these, the source needs a channel: Map a source to a channel.
The test is simple. If the value would be the same on every row of this source, use a fixed value. If it changes, it needs to come from a column, even a messy one.
Finish setting up the field
Below the value section, you'll find:
Where it lands. The data category this field belongs to, inherited from the source.
Metric type. For paid marketing sources, which standard measure this is. Spend is mandatory for any source you plan to model.
Roll-up and format. How the number combines over a date range, and how many decimal places it keeps.
Click Save changes when you're done.
Frequently asked questions
What is Data Transformation in Lifesight?
Data Transformation is where you define what each column from your data sources means in Lifesight. By mapping source columns to shared Lifesight fields, you make sure data from different platforms uses the same names, so it can be combined and compared accurately in reports and models.
Why do I need to map my data?
Every platform names its data differently. Google Ads might call a column spend, while a finance sheet calls it Media Investment. Mapping tells Lifesight these mean the same thing, so they can be added up and modeled together.
What is the difference between a source column and a Lifesight field?
A source column is the data as the platform provides it, with the platform's own name. A Lifesight field is the shared name Lifesight and your models use, such as Spend, Clicks, or Revenue. Mapping connects the two.
What does the green check mark next to a source mean?
A green check mark means the source's mandatory fields are mapped and the data is ready to use.
What are data categories?
Data categories group sources by the type of data they hold: KPIs, Paid Marketing, Organic, Contextual, and Others. The category decides which Lifesight fields are offered when you map a source's columns.
What is the difference between a dimension and a metric?
A dimension describes a row, such as Country, Campaign Name, or Date. You use dimensions to group, filter, and split data. A metric measures a row, such as Spend or Clicks, and can be combined using a roll-up.
What is a roll-up?
A roll-up is the rule for combining a metric's values across rows, such as when daily data is combined into a monthly total. Use Sum for values that accumulate, like spend or clicks, and Average for rates or ratios. Min, Max, and Count are also available.
Why shouldn't I use Sum for a percentage?
Adding percentages together produces a meaningless number. For example, adding 30 daily click-through rates doesn't give you a monthly click-through rate. Use Average for rates instead.
How do I change a column from a dimension to a metric?
Open the column's actions menu and select Make Dimension or Make Metric. This only changes how the column is displayed and modeled, not the underlying data.
Which date format should I use?
Use YYYY-MM-DD for dates and YYYY-MM-DD HH:MM:SS for dates with times. These formats can't be misread, unlike formats such as 03/04/2025, which could mean March or April.
What is a measurement dimension?
A measurement dimension is a dimension you've flagged for use in models and taxonomy. Once flagged, it appears under Your dimensions when building a data model and becomes available in Data Taxonomy.
Which dimensions should I flag as measurement dimensions?
Flag dimensions you genuinely want to model or classify by, such as country, brand, region, or product line. Avoid flagging dimensions like Ad ID, since flagging too many makes the model builder and rules editor harder to use.
Why do I need to map a source to a channel?
Everything downstream groups data by channel. Mapping a source to a channel tells Lifesight which channel its data belongs to, such as Paid Social, so it's attributed correctly in your models.
Do native integrations need a channel mapping?
No. Native connectors already know their channel. For example, Google Ads automatically carries Google and YouTube. Channel mapping is mainly needed for CSV and spreadsheet sources.
How do I map a file where one column contains the channel name?
Choose A column holds the channel, select that column, and map each value to a channel. Lifesight suggests matches for common abbreviations, such as fb for Facebook Ads, but review them before accepting.
When should I use a fixed value instead of a field from the source?
Use a fixed value when the value is the same on every row from the source. Use a field from the source when the value changes from row to row.
Do I have to map every column?
No. Map only the columns you'll use. You can always come back and map a column you've skipped.
Which fields are mandatory?
For a paid marketing source you plan to model, Spend and a date field are mandatory. Until they're mapped, the source shows as Unmapped and can't be used downstream.
Does changing a mapping apply to historical data?
Yes. A mapping is a definition, not a one-time import, so updated mappings apply to all the historical data you already have.
Where do I classify campaigns into tactics?
Campaign classification happens in Data Taxonomy, not Data Transformation. Data Transformation defines what columns mean, while Data Taxonomy groups campaigns into tactics (the marketing approach a campaign uses, such as prospecting or retargeting).
Updated about 1 hour ago