
Normalized root mean squared error (NRMSE)
Introduction
Accurately measuring model performance is crucial for making informed decisions. Among various performance metrics, the Normalized Root Mean Squared Error (NRMSE) stands out as a powerful tool for assessing predictive accuracy.
Definition and Concept
NRMSE is a normalized version of the Root Mean Squared Error (RMSE). While RMSE measures the average magnitude of errors between predicted and observed values, NRMSE adjusts this measure to be on a scale relative to the range or variance of the actual data. This normalization makes it easier to interpret across different datasets or contexts in marketing mix modeling.
Formula
The NRMSE is calculated as:
NRMSE = RMSE / Range of Actual ValuesWhere:
-
RMSE (Root Mean Squared Error) is calculated as:
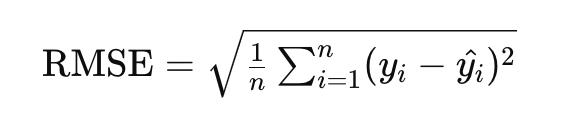
Here, $y_i$ represents the actual values, $\hat{y_i}$ the predicted values, and $n$ the number of observations.
-
Range of Actual Values is typically the difference between the maximum and minimum values in the dataset:
Range = max(y) - min(y)
Purpose
NRMSE provides a standardized way to assess the prediction accuracy of marketing mix models. By normalizing RMSE, it accounts for the scale of the data, making it easier to:
- Compare models across different datasets
- Evaluate performance across various marketing contexts
- Track model improvements over time
Visual Representation

This graph illustrates how NRMSE compares predicted values to actual values, with the normalization providing a consistent scale for evaluation.
Interpretation
- Lower NRMSE: Indicates a model with better predictive accuracy relative to the scale of the data.
- Higher NRMSE: Suggests that the model's predictions are less accurate relative to the data range.
Note: There's no universal threshold for a "good" NRMSE, as it depends on the specific context of your marketing data and goals.
Use in Marketing Mix Modeling
In MMM, NRMSE helps evaluate how well the model performs in predicting actual business outcomes (e.g., sales, ROI) based on marketing inputs. It's particularly useful for:
- Model Comparison: Assess different model structures or algorithms
- Performance Tracking: Monitor model improvements over time
- Cross-Channel Analysis: Compare predictive accuracy across different marketing channels
- Scenario Planning: Evaluate the reliability of predictions for various marketing scenarios
Advantages and Limitations
Advantages:
- Scale-independent, allowing for fair comparisons across different datasets
- Provides a clear measure of model accuracy relative to data variability
- Useful for comparing models with different units or scales of measurement
Limitations:
- Can be sensitive to outliers in the dataset
- May not fully capture the nuances of model performance in complex marketing scenarios
- Should be used in conjunction with other metrics for a comprehensive model evaluation
Best Practices
When using NRMSE in Marketing Mix Modeling:
- Contextual Interpretation: Always interpret NRMSE values within the context of your specific marketing data and business goals.
- Complementary Metrics: Use NRMSE alongside other metrics like R-squared and MAPE for a more comprehensive model evaluation.
- Consistent Application: When comparing models or tracking improvements, ensure consistent calculation methods across all evaluations.
- Regular Monitoring: Continuously track NRMSE to detect changes in model performance over time, especially after significant market changes or model updates.
By considering NRMSE along with other relevant metrics, marketers can gain a comprehensive view of their model's performance and its effectiveness in guiding marketing strategies.
Definition:
NRSME is a normalized version of the Root Mean Squared Error (RMSE). RMSE measures the average magnitude of the errors between predicted and observed values. NRSME adjusts this measure to be on a scale relative to the range or variance of the actual data, making it easier to interpret across different datasets or contexts.
Formula:
NRSME = RMSE / Range of Actual Values
where:
-
RMSE is calculated as:
with ( y_i ) being the actual values, ( \hat{y_i} ) being the predicted values, and ( n ) being the number of observations.
-
Range of Actual Values is typically the difference between the maximum and minimum values in the dataset.
Purpose:
NRSME provides a standardized way to assess the prediction accuracy of the model. By normalizing RMSE, it accounts for the scale of the data, making it easier to compare models across different datasets or marketing contexts.

Interpretation:
- A lower NRSME indicates a model with better predictive accuracy relative to the scale of the data.
- A higher NRSME suggests that the model's predictions are less accurate relative to the data range.
Use in MMM:
In Marketing Mix Modeling, NRSME helps evaluate how well the model is performing in terms of its ability to predict actual business outcomes (e.g., sales, ROI) based on marketing inputs. It’s particularly useful for comparing the performance of different models or assessing improvements over time.
By considering NRSME along with other metrics like R-squared and MAPE, marketers can get a comprehensive view of the model’s performance and its effectiveness in guiding marketing strategies.
Updated 8 days ago