
Causal Graph: See how your channels work together
Use causal graph relationships to understand modeled effects.
The Causal Graph shows the causal structure your selected model uses, so you can understand not just how much each channel contributed, but how it got there.
A model does more than estimate each channel's contribution. It works from a view of how your drivers relate to each other: which ones influence outcomes directly, and which ones work by shifting something else first. Upper-funnel video that lifts branded search is the classic example. The spend shows up in one place, and part of its value shows up in another.
The Causal Graph makes that view visible. You can see every relationship the model uses, trace how each driver reaches your outcome, and check whether the structure matches what you know about your business.
When a channel's contribution looks lower than expected, this is usually where you'll find the explanation.
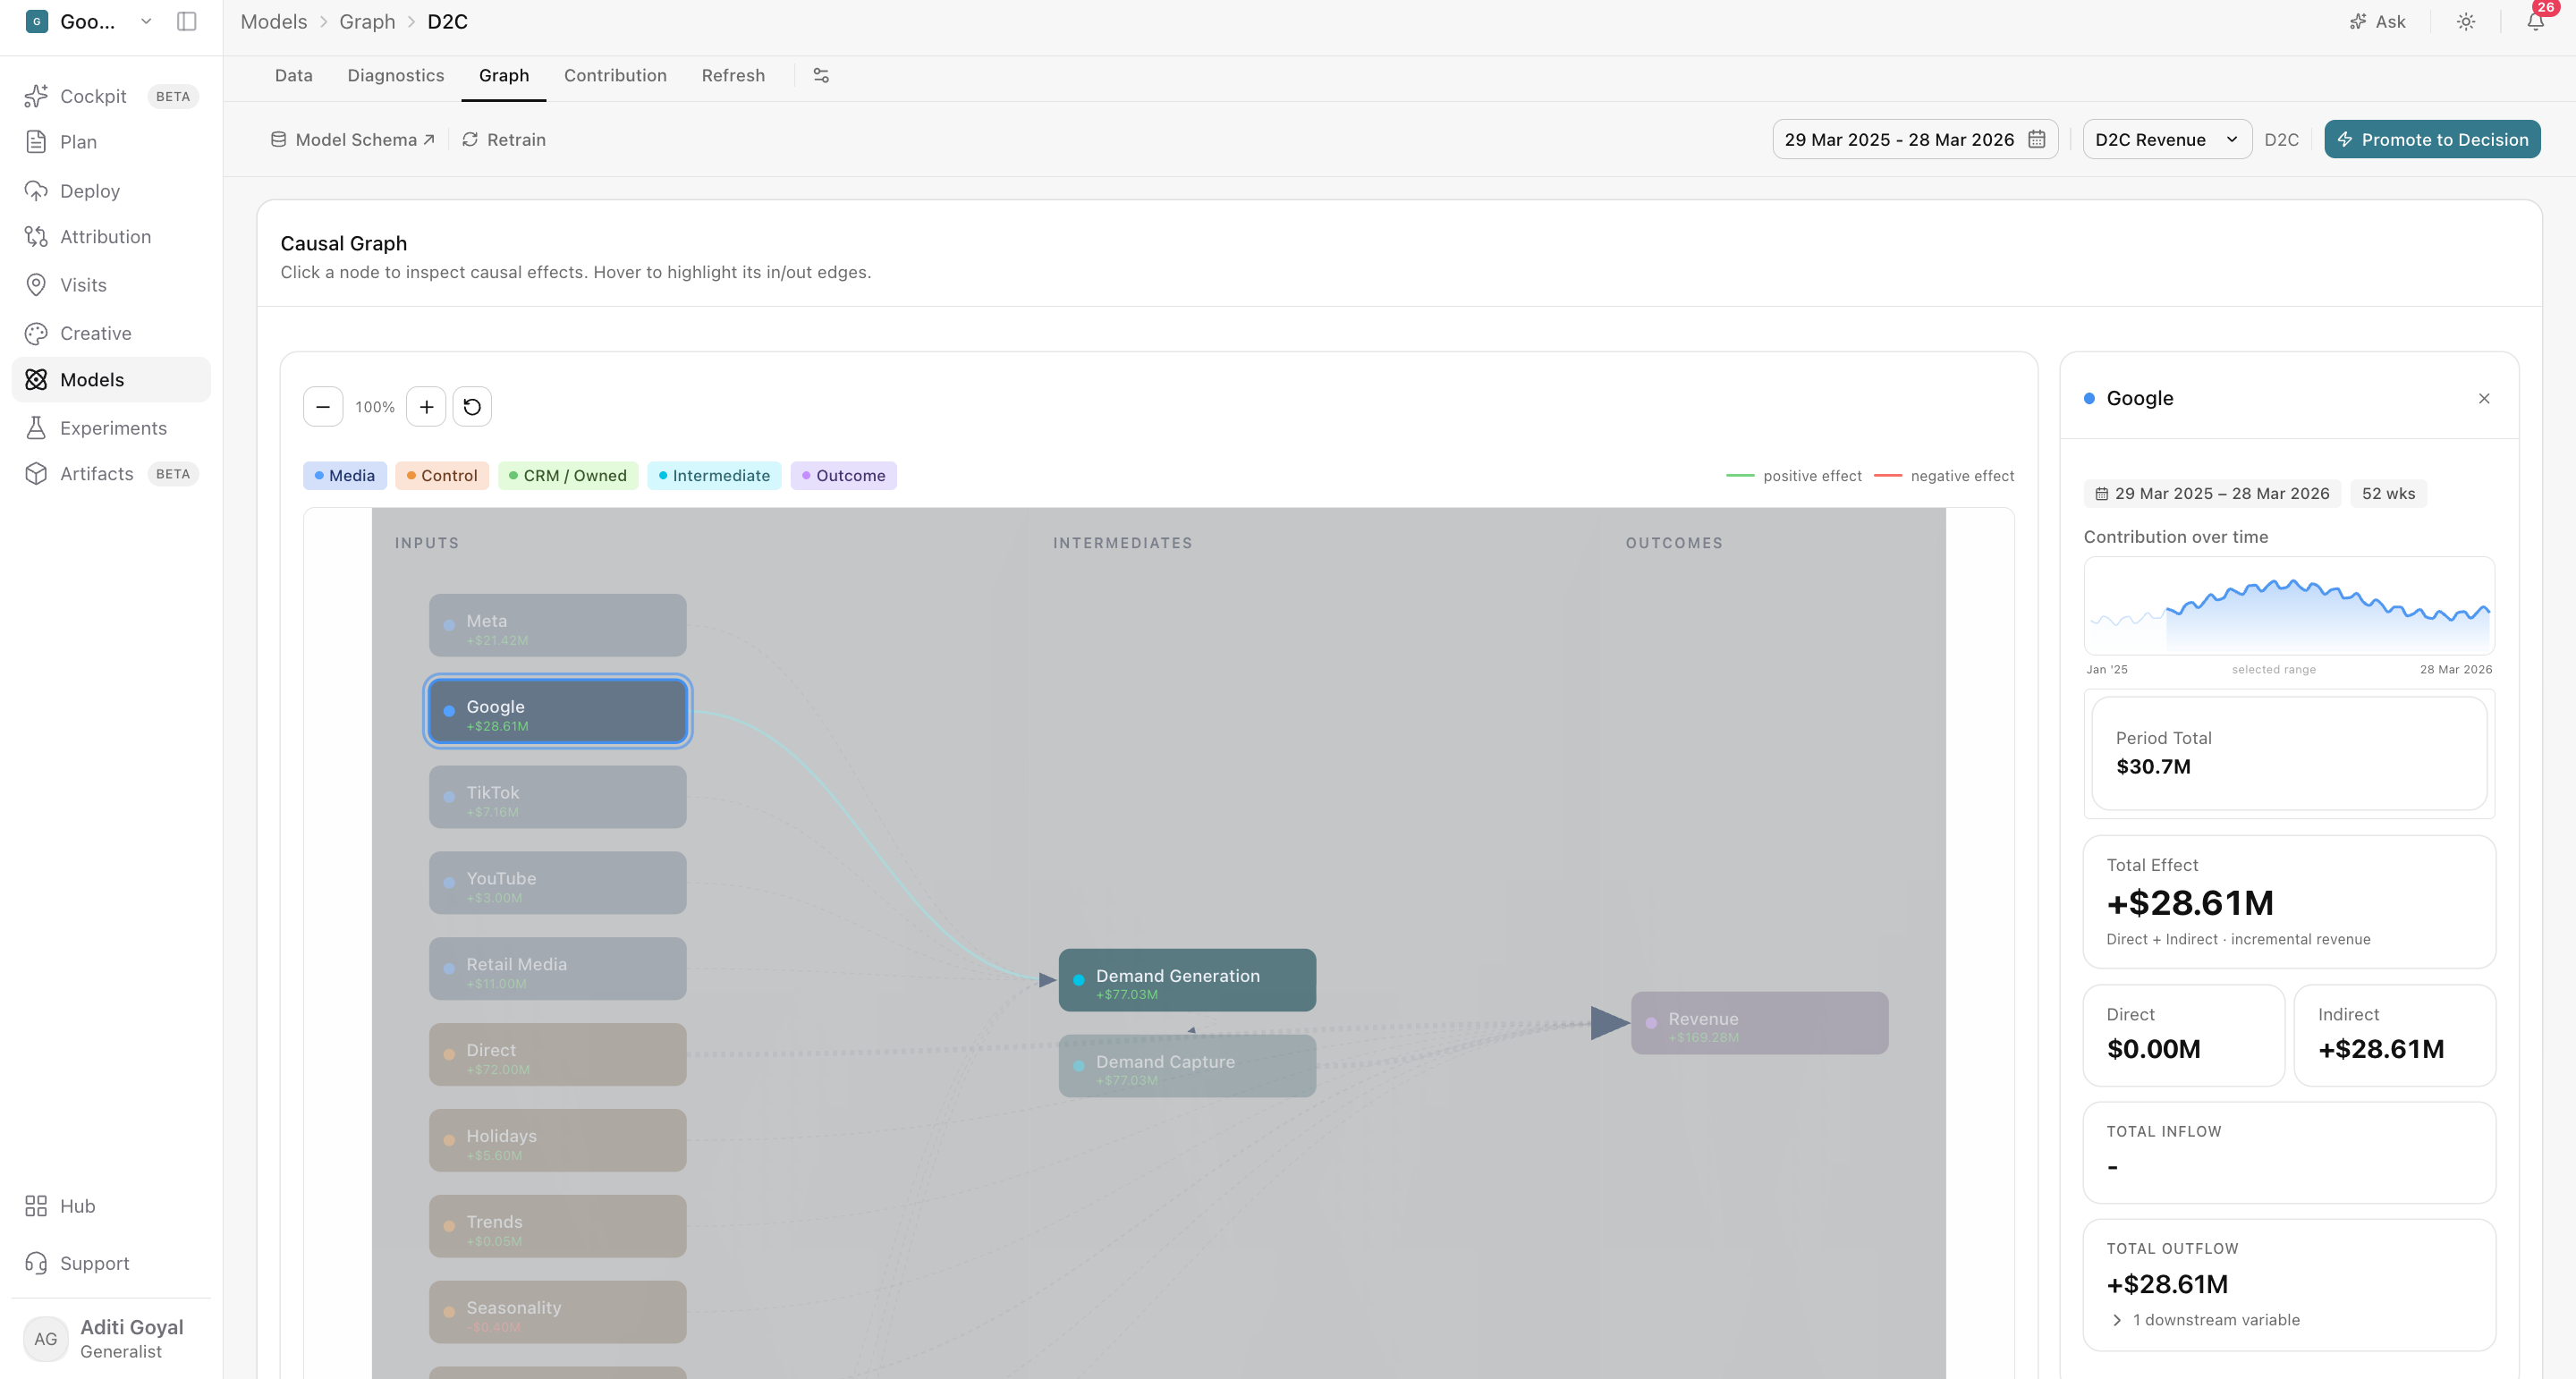
Explore how your drivers connect
The graph lays out your model in three columns:
- Inputs are the variables you control or account for, including media channels, control variables (non-media factors such as pricing or seasonality), and CRM or owned activity.
- Intermediates are the variables that sit in between, such as demand generation (creating new interest in your brand) and demand capture (converting people who are already looking).
- Outcomes are what you're measuring, such as revenue.
The lines between them show the relationships the model uses, colored by whether the effect is positive or negative. Hover over a variable to highlight the effects flowing into and out of it.
Click a variable to open its detail panel.
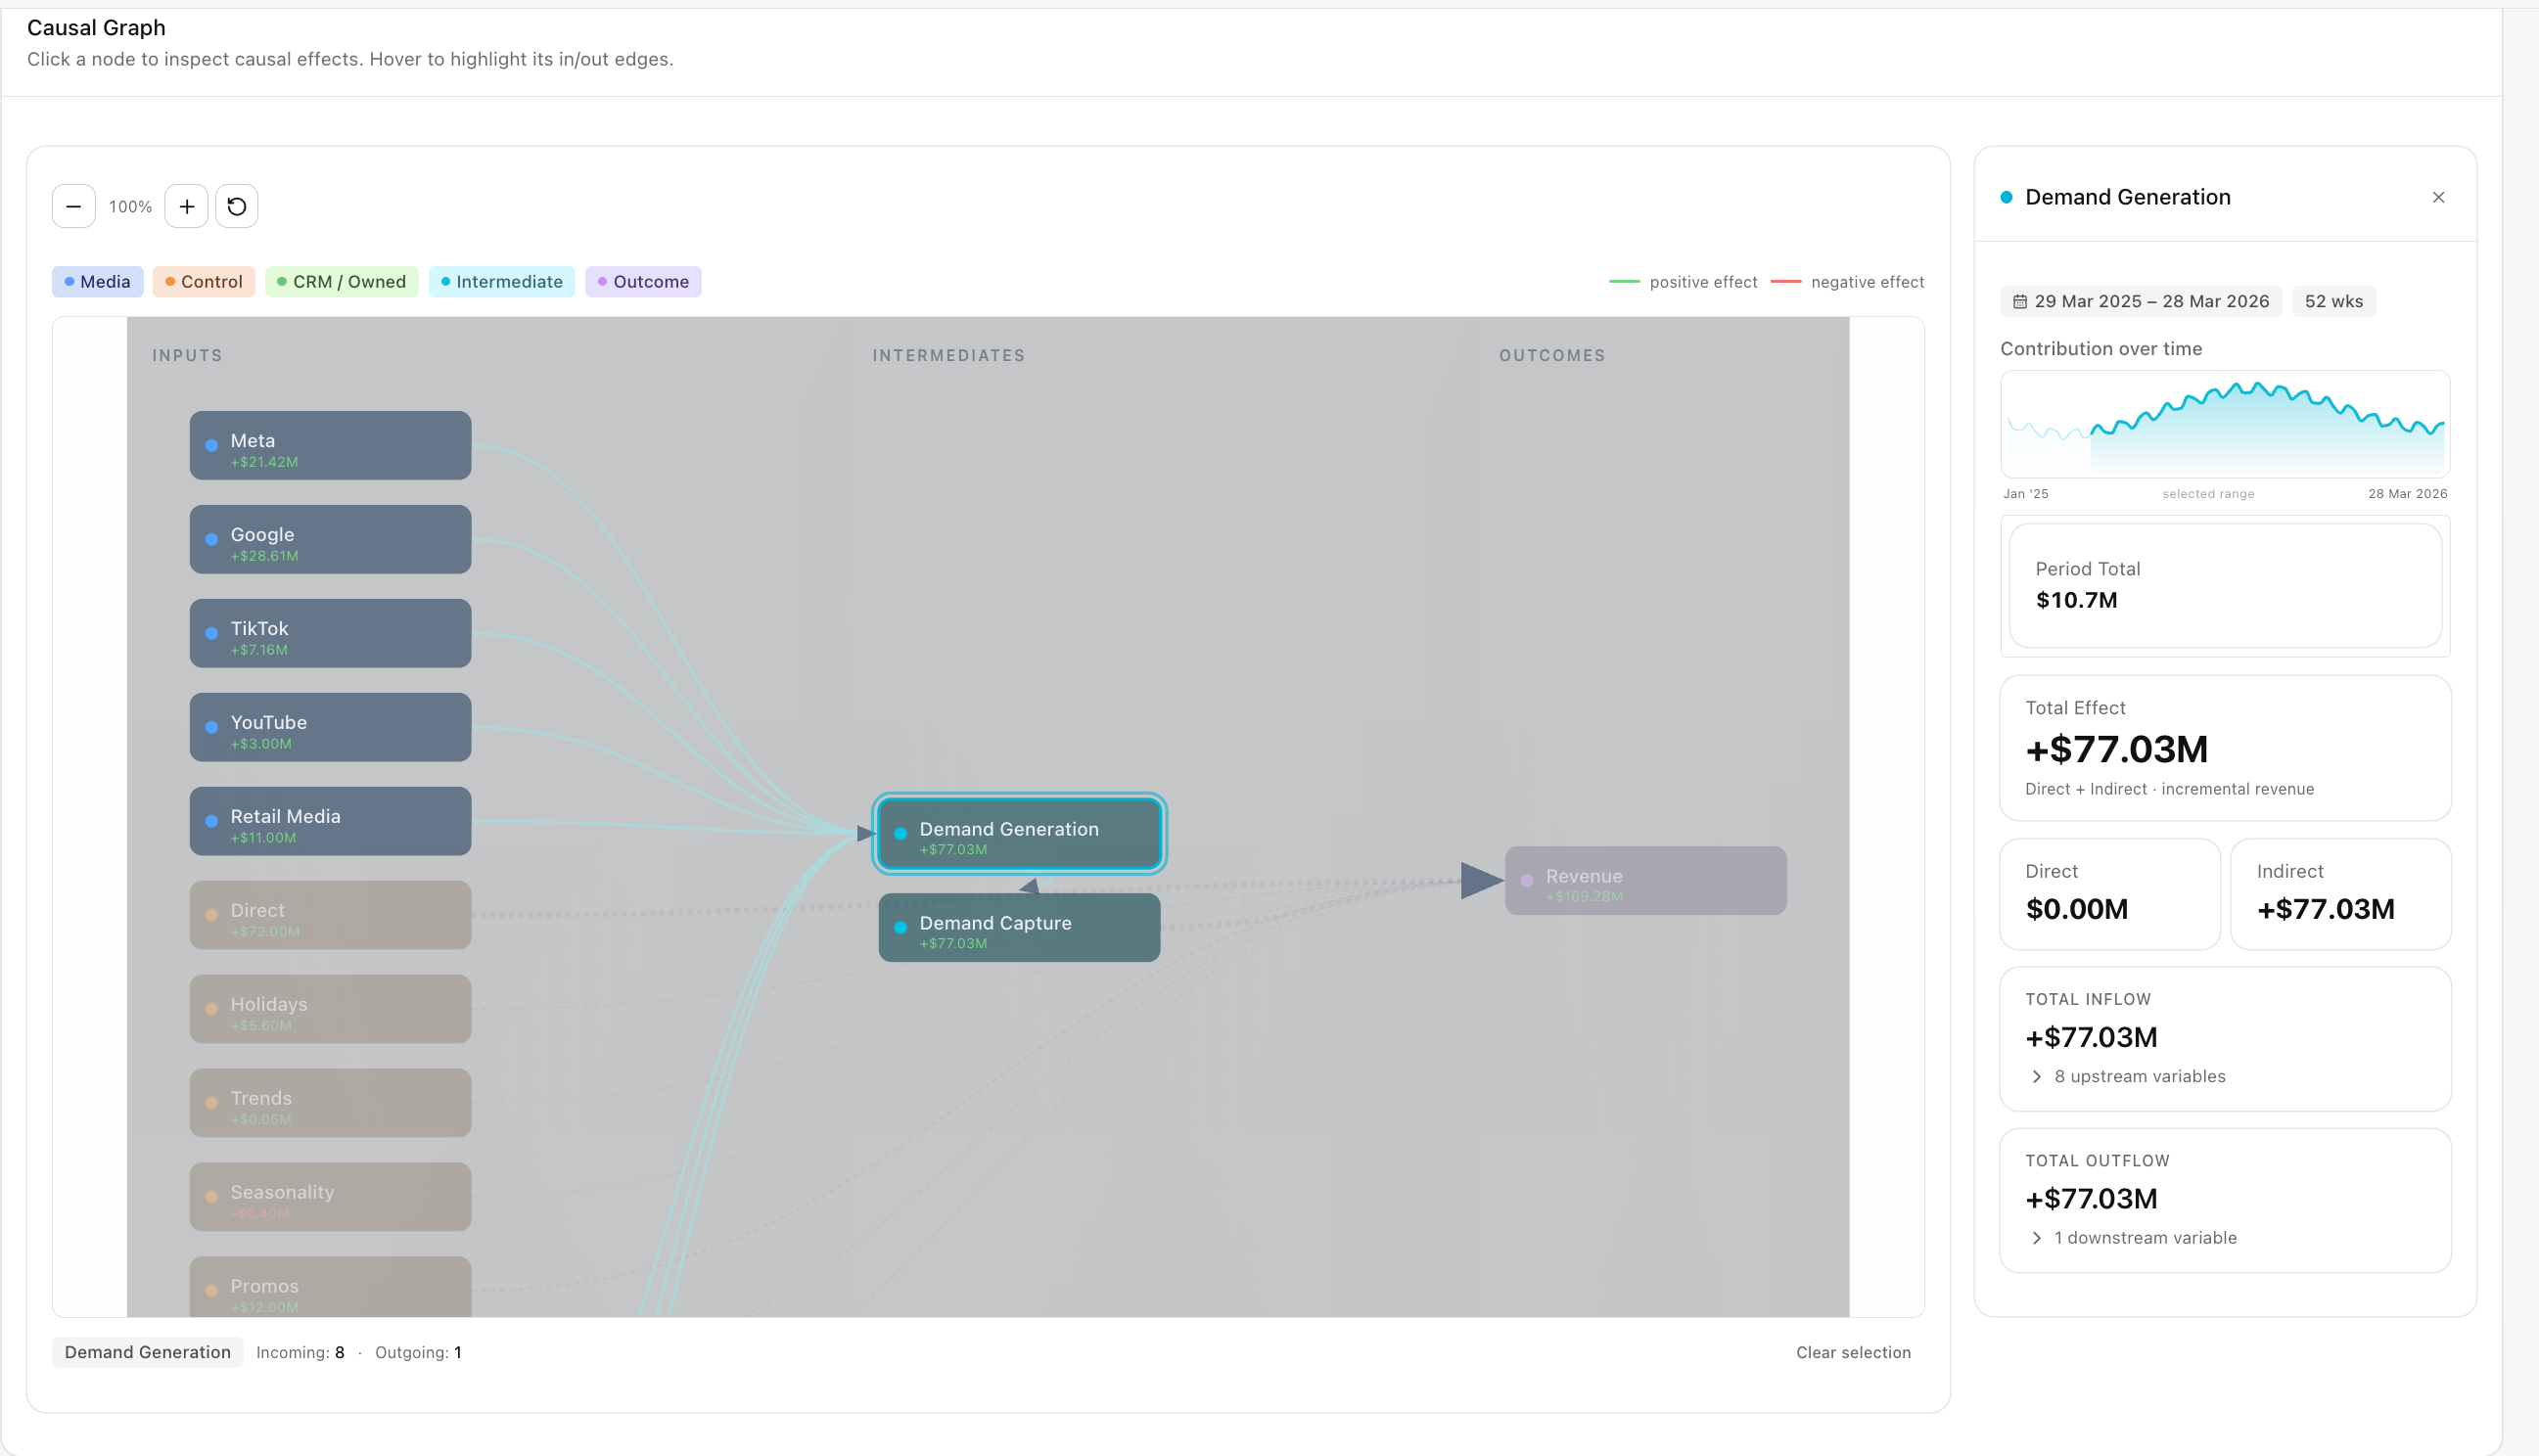
The detail panel shows:
- Total inflow: the combined effect of everything upstream that feeds into the variable
- Total outflow: the combined effect the variable passes on to downstream variables
- Direct, indirect, and total effect on the outcome, where available
- Contribution over time and the period total for the selected date range
Inputs usually show no inflow, since nothing in the model feeds into them. Outcomes usually show no outflow, since nothing sits downstream of them.
Trace every path before comparing numbers
-
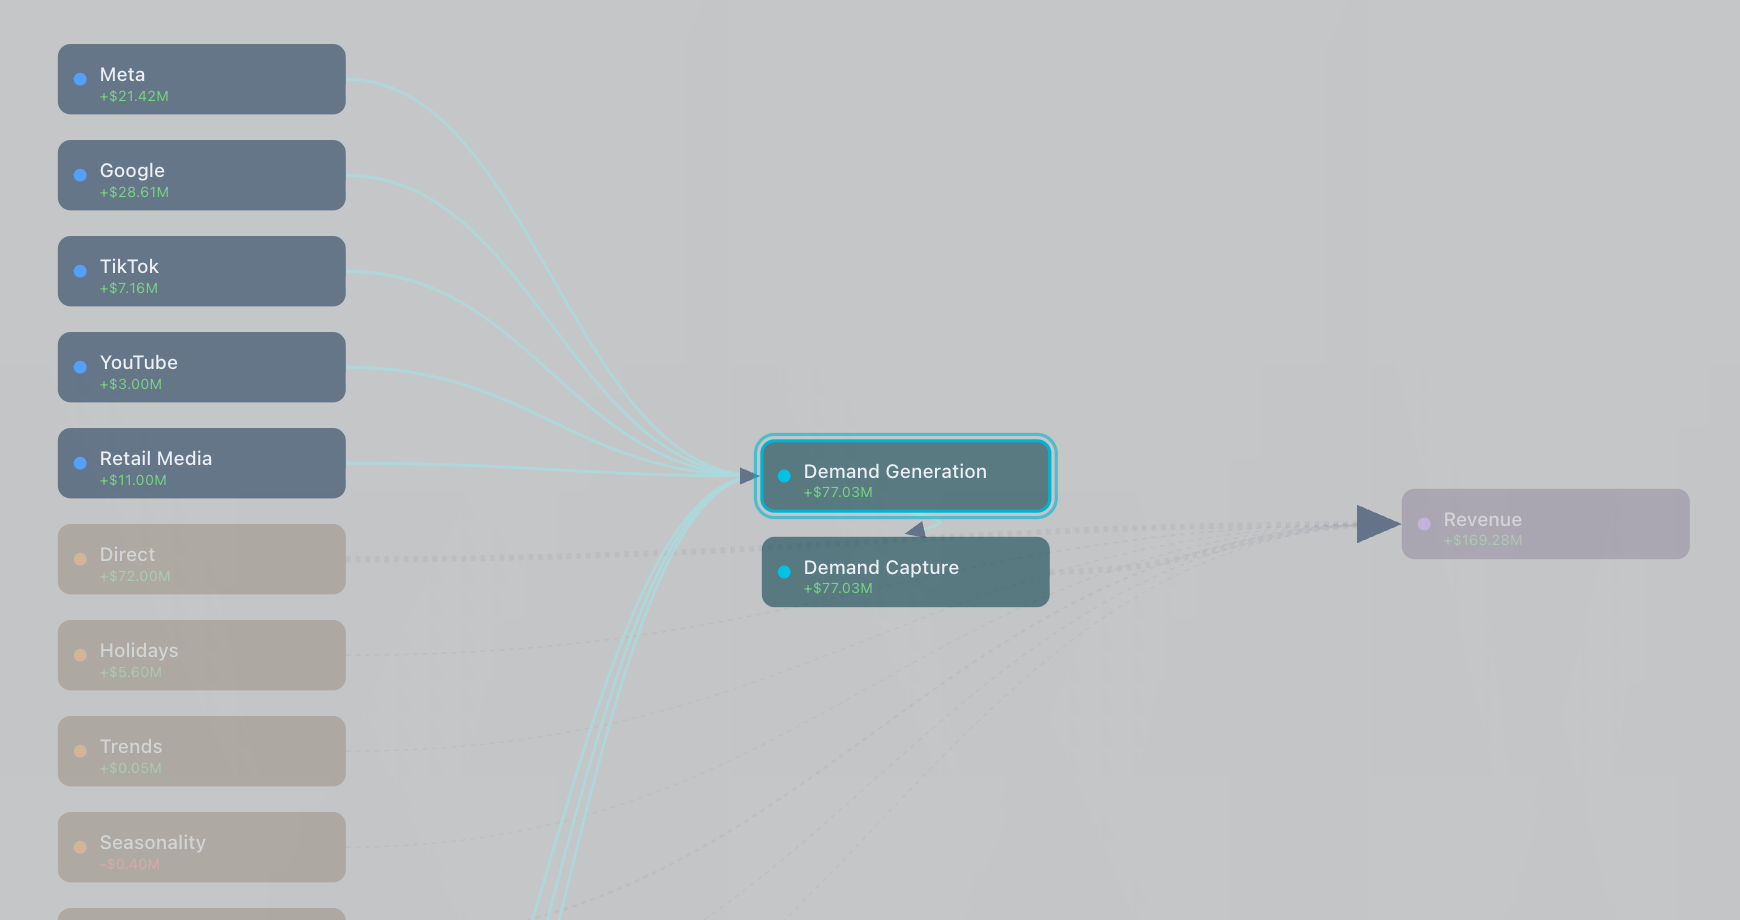
Direct effect is the effect a variable has on the outcome with nothing in between. The line runs straight from the variable to the outcome.
-
Indirect effect is the effect that travels through one or more intermediates. The variable moves an intermediate, such as demand generation, and that intermediate moves the outcome.
-
Total effect combines all available direct and indirect paths. This is the incremental revenue the model attributes to the variable across every route it takes.
Comparing channels on direct effect alone can undervalue those that work mainly through other channels, such as upper-funnel video. Check the total effect before drawing conclusions.
Check how confident the model is in each channel
The Contribution view can show a causal status for each channel or tactic:
- Confident means the model has stronger causal support for the estimate.
- Watch means lower confidence, so the estimate needs further review.
- A dash means no causal status is available.
Use the Causal Graph to inspect the relevant paths, then check uncertainty and model behavior before acting on an estimate.
Frequently asked questions
What is the Causal Graph in Lifesight?
The Causal Graph shows the causal structure your model uses. It maps how inputs such as media channels influence intermediates and outcomes, so you can see how each driver contributes to results.
Why does a model need a causal structure?
Channels don't always affect outcomes directly. Some work by lifting other activity first, such as video increasing branded search. A causal structure lets the model credit each channel for its full impact, including value that shows up elsewhere.
Why does a channel's contribution look lower than expected?
Part of its value may flow through other variables. Open the Causal Graph, click the channel, and compare its direct, indirect, and total effect to see the full picture.
What are inputs, intermediates, and outcomes?
Inputs are variables you control or account for, such as media channels and control variables. Intermediates sit in between, such as demand generation and demand capture. Outcomes are what you measure, such as revenue.
What do the colors of the lines mean?
Line colors show whether a relationship has a positive or negative effect.
How do I see the relationships for a single variable?
Hover over a variable to highlight the effects flowing into and out of it. Click it to open the detail panel.
What does the detail panel show?
The detail panel shows total inflow, total outflow, direct, indirect, and total effect on the outcome where available, and contribution over time for the selected date range.
What is the difference between total inflow and total outflow?
Total inflow is the combined effect of everything upstream that feeds into a variable. Total outflow is the combined effect the variable passes on to downstream variables.
Why do inputs show no inflow?
Nothing in the model feeds into inputs, so they usually have no inflow. Outcomes usually have no outflow for the same reason, since nothing sits downstream of them.
What is the difference between direct, indirect, and total effect?
Direct effect is a variable's impact on the outcome with nothing in between. Indirect effect travels through one or more intermediates. Total effect combines both and represents the full incremental revenue the model attributes to the variable.
Which effect should I use to compare channels?
Use total effect. Comparing on direct effect alone can undervalue channels that work mainly through other channels, such as upper-funnel media.
What does the causal status in Contribution mean?
Confident means stronger causal support for the estimate. Watch means lower confidence and a need for further review. A dash means no causal status is available.
What should I do if a channel shows Watch?
Inspect the channel's paths in the Causal Graph, then review its uncertainty and model behavior before acting on the estimate.
How do I know if the causal structure is right?
Check whether the relationships match what you know about your business. For example, confirm that upper-funnel channels connect to demand generation and that no relationship runs in an implausible direction.
Can I change the causal structure from the Causal Graph?
No. The Causal Graph shows the structure the model uses. To change relationships, update them in the Causal Relationships step when creating or retraining a model.
Related Articles
Updated about 2 hours ago