
Build a schema for Marketing Mix Modelling
Define the KPI, media and context for a mix model, so it can decompose what actually drove your results.
A marketing mix model answers one question: of everything that happened last year, how much of the outcome did each thing cause. To answer it, the model needs to know what the outcome is, what you spent, and what else was going on that had nothing to do with your marketing.
This schema is where you tell it. Get the third part wrong and the model will hand credit for your Black Friday promotion to whichever channel happened to be spending in November.
When to use it
Choose this schema type when you want to:
- understand how much each channel and tactic contributed to revenue or another KPI
- find where the next pound is best spent, and where you are already saturated
- run pre and post or hold-out tests along a time axis
If you want to compare matched test and control regions instead, use Build a schema for Geo Experiments.
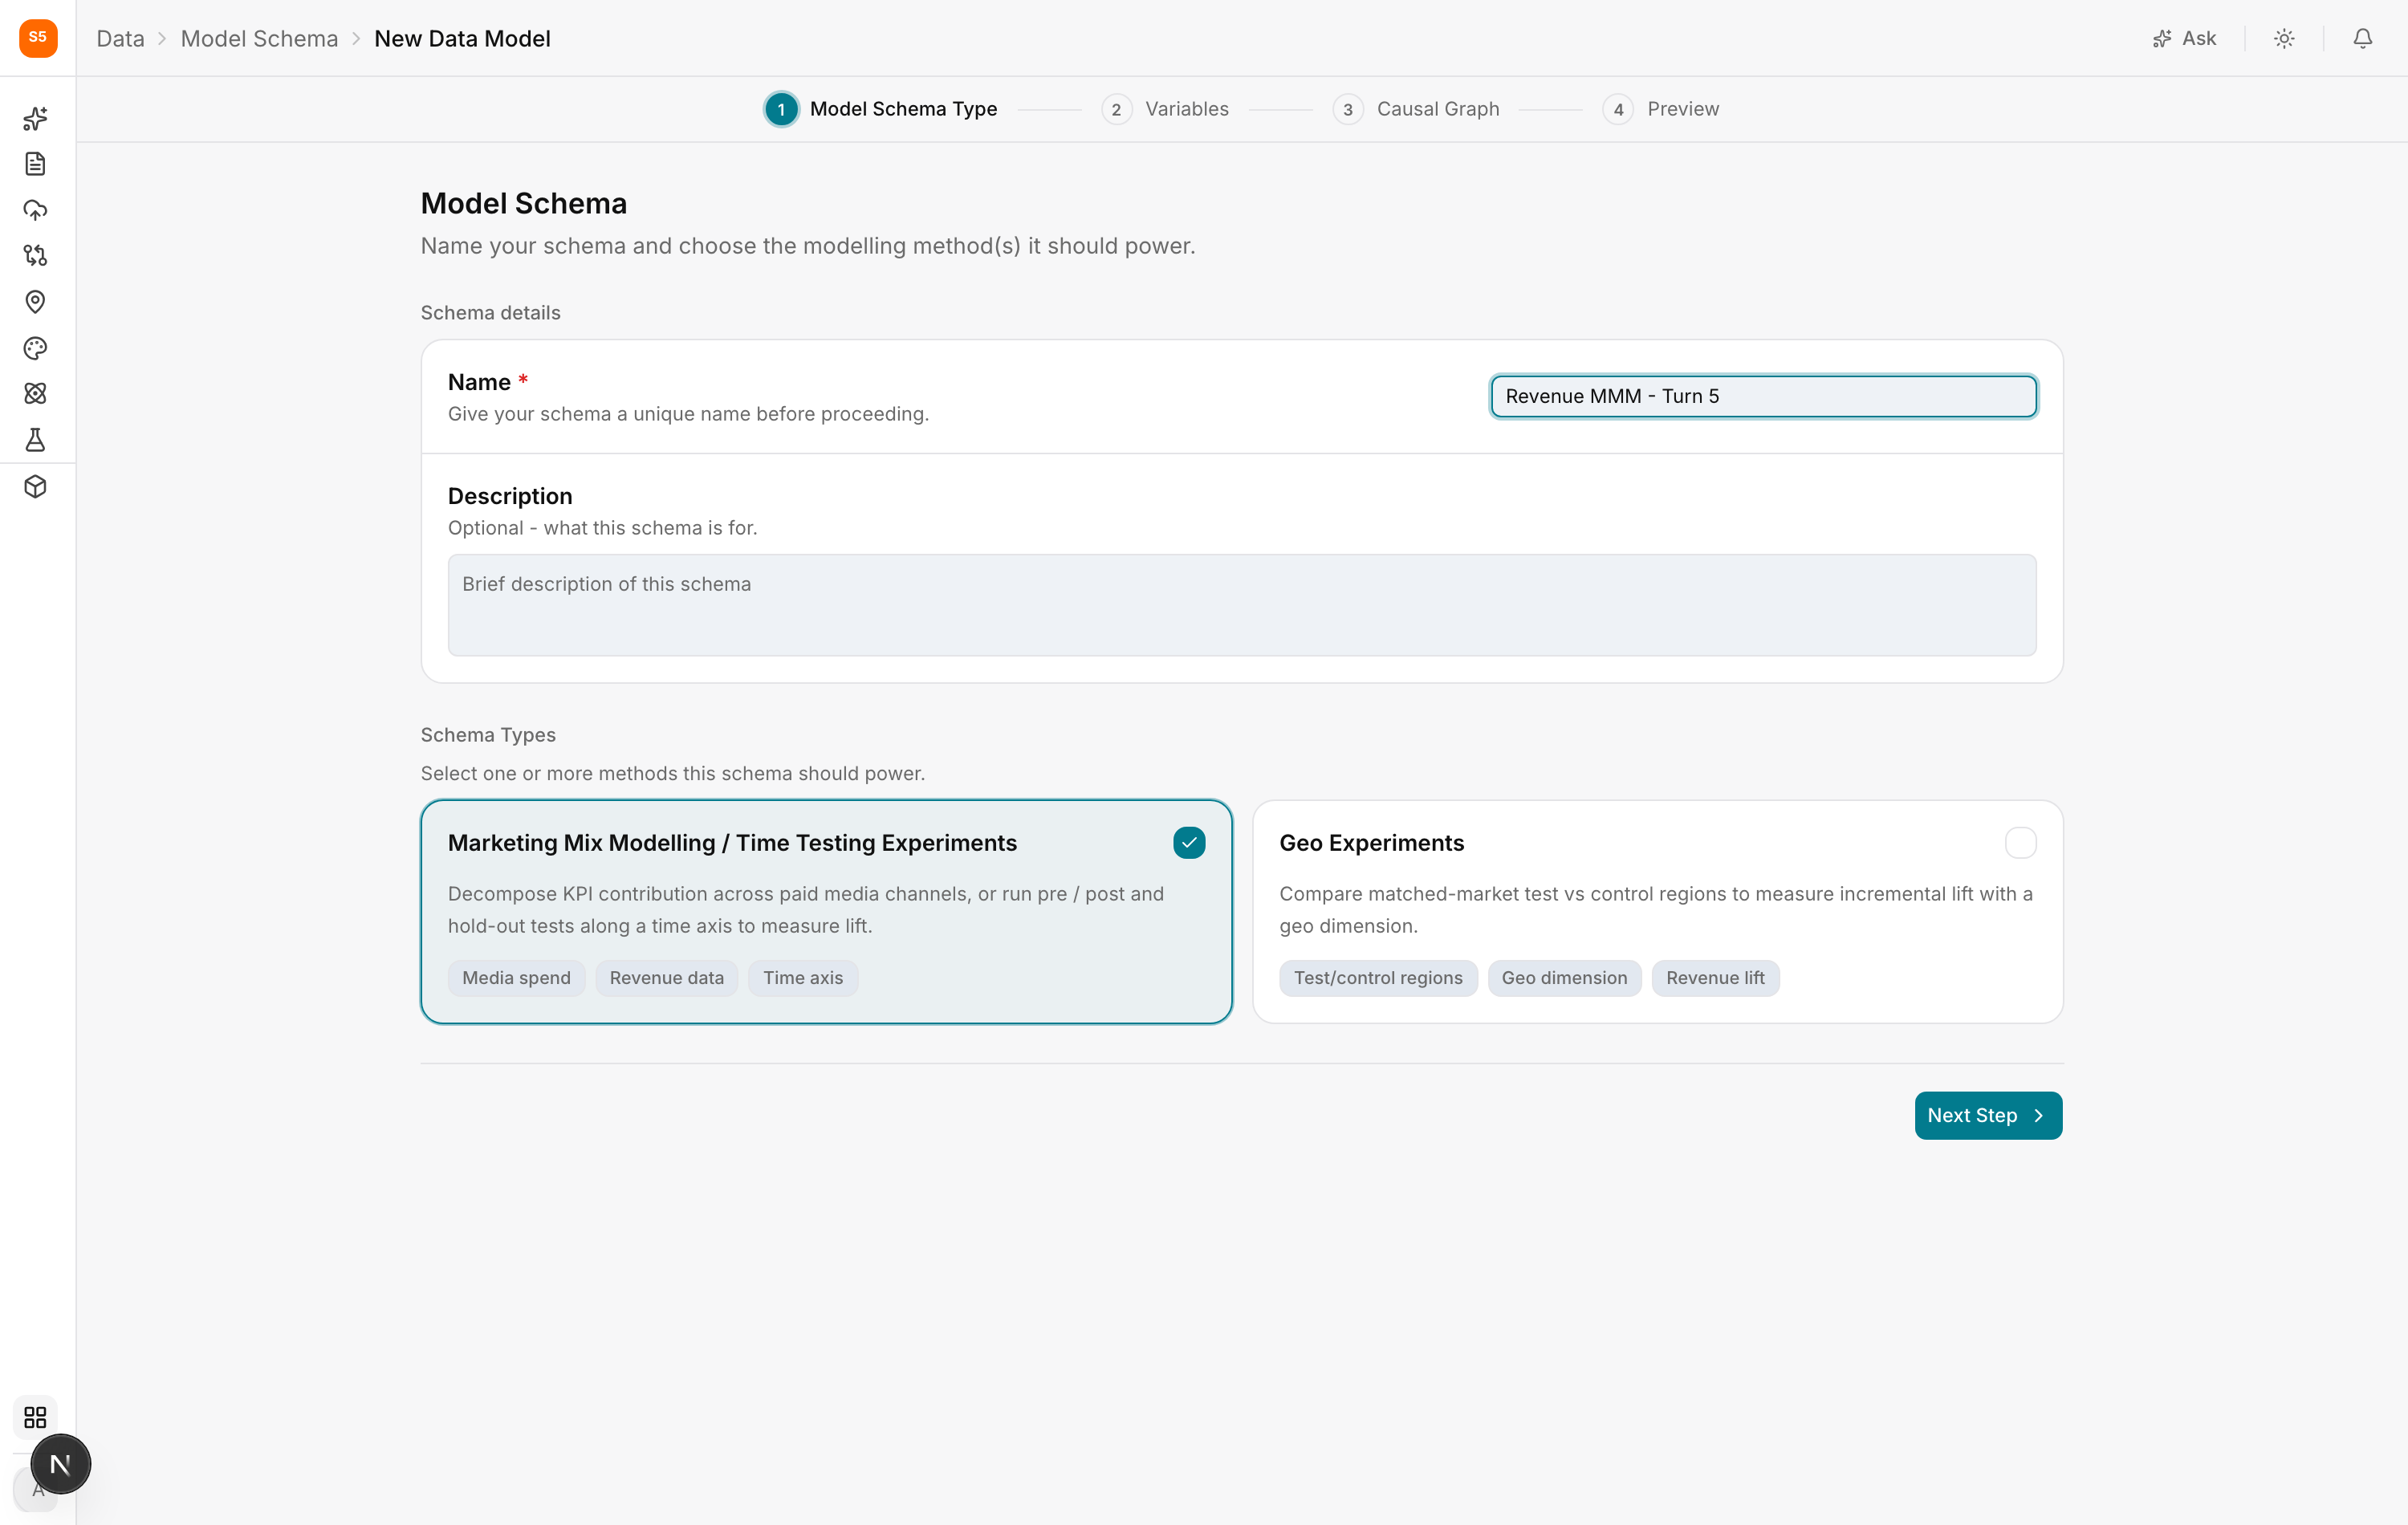
Step 1: Model Schema Type
Name the schema after the question it answers. Revenue MMM UK is more useful in six months than Model 3.
Select Marketing Mix Modelling / Time Testing Experiments. It needs media spend, revenue data and a time axis, all of which come from the sources you connected earlier.
Step 2: Variables
This is the step that determines whether the model is any good.
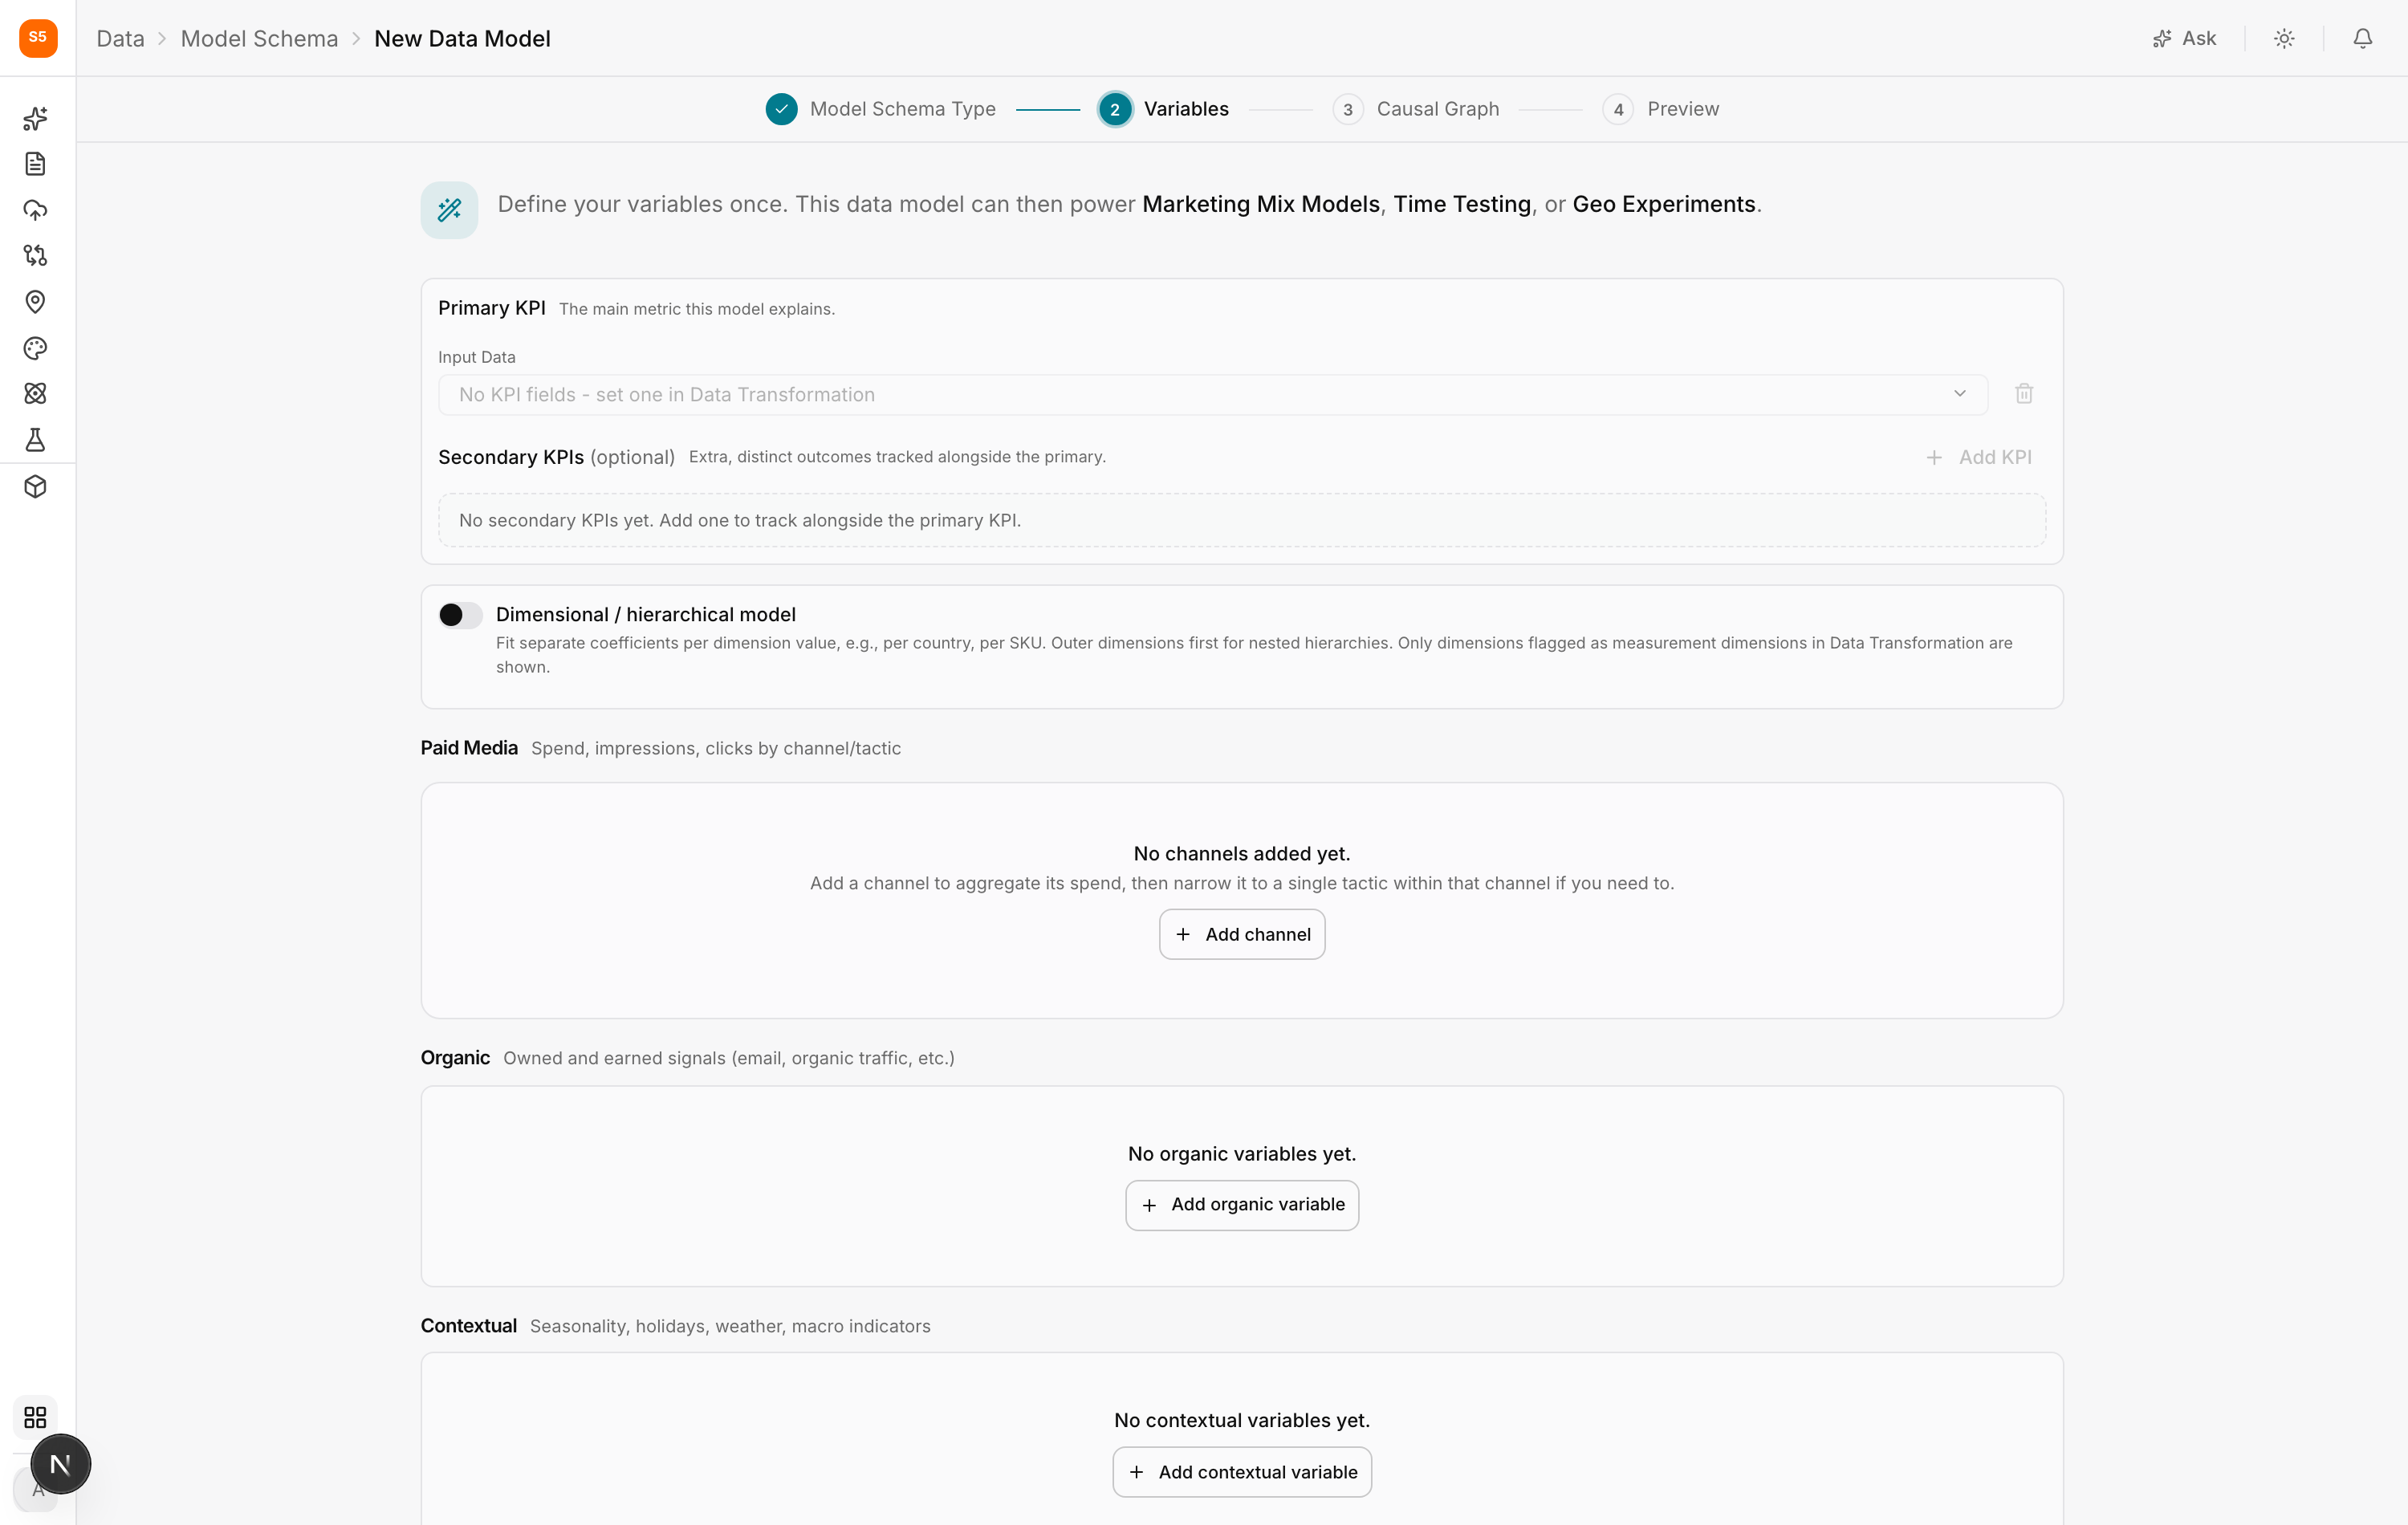
Primary KPI. The one metric the model exists to explain. Only fields categorised as KPI in Data Transformation are offered.
Choose what the business is actually judged on. If that is profit, modelling revenue will tell you how to sell more at any margin, which is a different question.
Secondary KPIs. Optional extra outcomes, useful when new customer acquisition matters as well as total revenue.
Dimensional / hierarchical model. Turn this on to fit separate coefficients per country, product line or similar. Only turn it on when media genuinely behaves differently across those groups and each group has enough data to stand alone. Splitting a thin dataset into ten pieces gives you ten unreliable answers instead of one solid one.
Paid Media. Add the channels whose spend you want measured, and narrow each to a tactic where the split matters. Tactics come from Data Taxonomy. Once you pick a channel, its spend, impressions and clicks fill in from the mappings you already made.
Include every channel you can plausibly change. Leaving a real channel out does not make it neutral. The model attributes its effect to whatever is left in, which inflates the others.
Organic. Email, organic sessions, affiliate activity. These move at the same time as paid media, and omitting them makes paid look better than it is.
Contextual. Seasonality, holidays, promotions, price changes, competitor activity. This is the most commonly skipped section and one of the most valuable.
For organic and contextual variables, choose how each enters the model: Continuous for a number that varies, Binary for on or off, Categorical for a set of named states.
Step 3: Causal Graph
Describe which things cause which. The point is to separate a channel that caused sales to rise from one that spent more because sales were already rising.
Without that distinction made explicit, a model can read the relationship backwards and recommend more of something that was following demand rather than creating it. Capture what you are confident about and leave the rest.
Step 4: Preview
Read the summary as a checklist:
- Is the primary KPI what the business is judged on?
- Is every meaningful paid channel present?
- Are the big non-marketing drivers of last year represented?
- If the dimensional option is on, does every group have enough data?
A worked example
A retailer wants to know what drove last year's revenue.
Primary KPI is Revenue from Shopify. Paid Media is Google split into Paid Search Brand and Non-Brand, Meta split into Prospecting and Retargeting, and YouTube as one channel. Organic is email sends and organic sessions. Contextual is a binary for promotional periods and a continuous variable for average discount depth, because Black Friday dominates their year.
In the Causal Graph they record that promotions drive revenue directly and also drive higher paid social spend, since they scale budgets during sales.
At Preview they notice affiliate spend is missing entirely, go back to connect it, and return before saving. That is normal. Building a schema is often what reveals the gap in your data.
Where this shows up in the rest of Lifesight
Marketing Mix Modelilng trains directly on this schema. Everything it reports, contribution by channel, baseline versus incremental revenue, and the saturation curves, is bounded by the variables you chose here.
Causal Flags reflect the relationships captured in the causal graph, which is how you can tell whether a channel has a genuine causal relationship with the outcome.
Insights and Channel Deep Dive report per tactic, so the granularity you set in Paid Media is exactly the granularity you can investigate later.
Planner forecasts and builds media plans from the model's response curves. A channel missing from the schema cannot appear in a plan.
Optimiser and Recommendations propose budget moves against those same curves, and act on them in the ad platforms.
Model Refresh and Retraining re-run against this schema as new data arrives, which is why it is worth defining properly once rather than rebuilding each quarter.
Model Calibration folds experiment results back in, so a geo test can sharpen the estimate the mix model produced.
Frequently asked questions
How many variables should I have?
Fewer than you think. Two years of weekly data is around 100 observations, and thirty variables will overfit. Start with what you can act on.
A field or tactic I need is not offered. It has not been mapped in Data Transformation or assigned in Data Taxonomy.
Can I have more than one schema?
Yes. Total revenue and new customer acquisition are different questions deserving different variable sets.
Related Articles
Updated about 1 hour ago