
CSV Data Formatting Guidelines
Prepare CSV data for Marketing Mix Modeling in Lifesight.
Getting your data right is what makes a Marketing Mix Model accurate and worth acting on.
You can build a model from an existing Data Model, or upload a CSV and map every field yourself. This page covers what your file needs, how to check it before you upload, and how much history it takes to get a model you can trust.
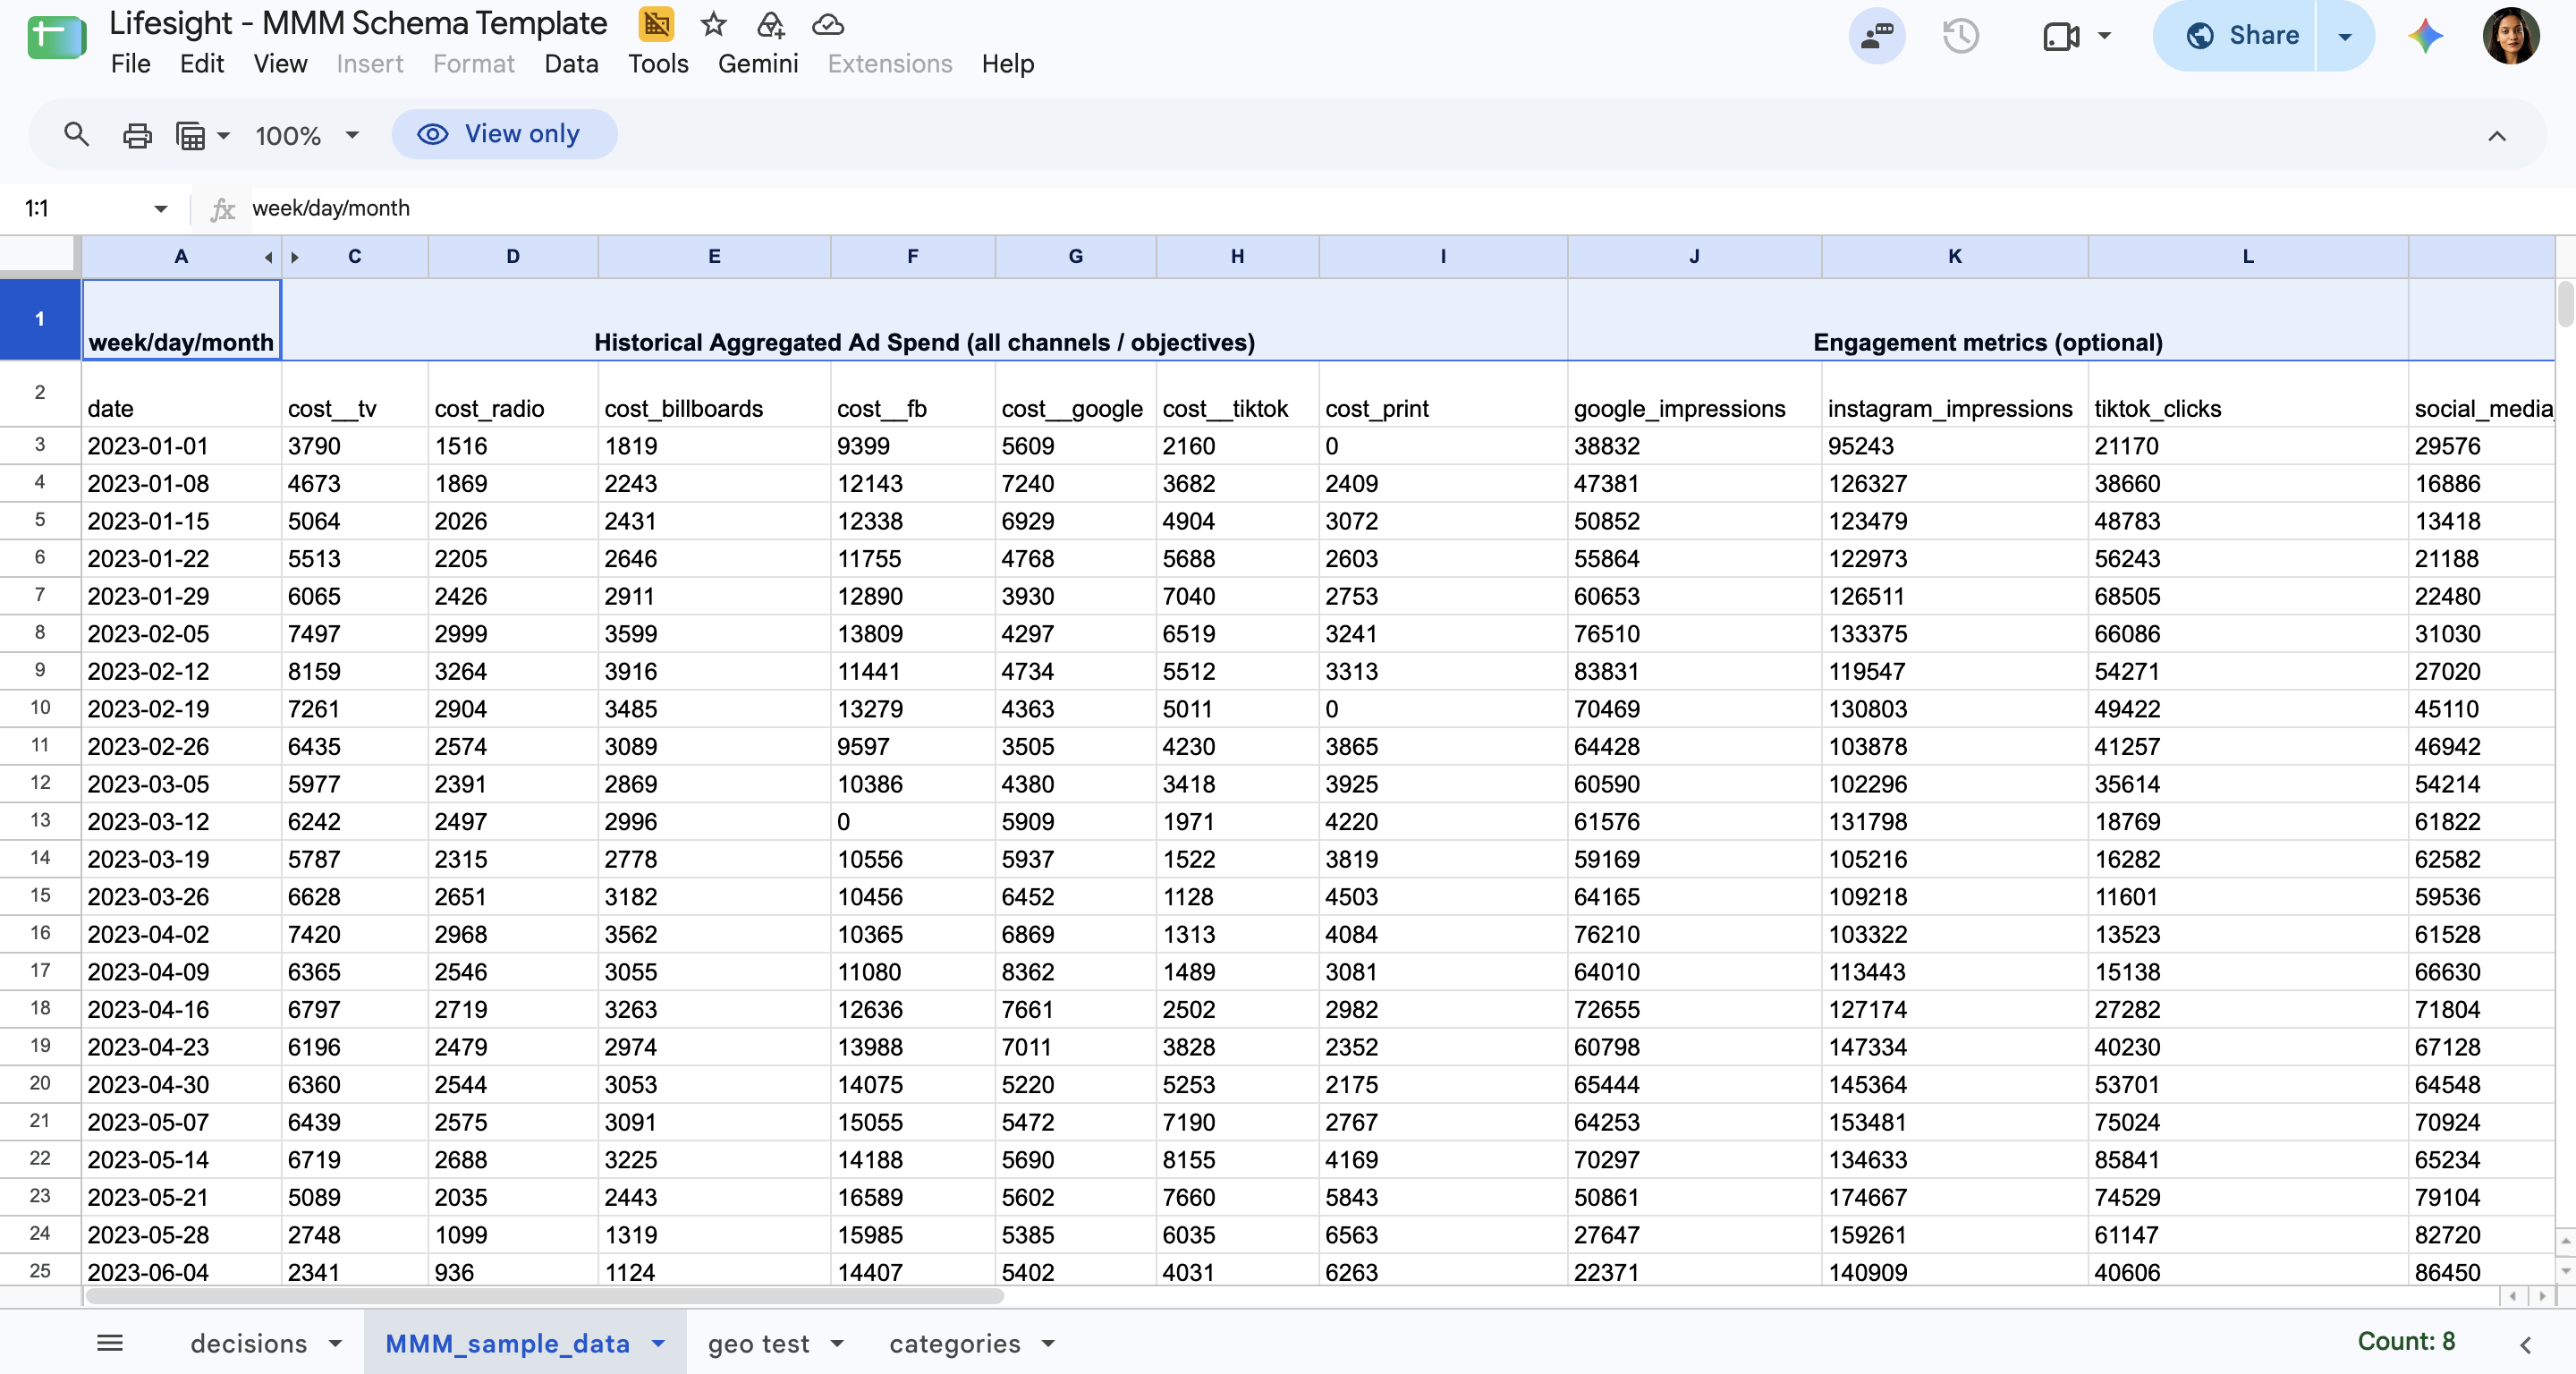
Bring the data your model needs
Your CSV must contain the fields that define the model's outcome, your paid media, and the time window it covers.
Columns you must include
- Date column: A date field in
YYYY-MM-DDformat. - KPI column: At least one outcome you want to model, such as
Revenue,Orders,Installs, orNew_Customers. - Paid media spend: At least one numeric spend field for a paid channel or tactic (a specific way of running a channel, such as prospecting or retargeting).
The variable mapper needs a channel and a spend field for every paid row. Tactic, impressions, and clicks are optional.
Columns that make your model sharper
| Category | Recommended variables |
|---|---|
| Paid media | Spend, impressions, and clicks at the channel or tactic level |
| Organic | Organic sessions, direct traffic, email activity, or other owned and earned signals |
| Contextual | Promotions, pricing changes, holidays, weather, competitor activity, or macro indicators |
| Halo | Cross-channel or cross-product variables used to represent spillover effects |
| Dimensions | Country, region, product, or another field used to fit dimensional child models |
For organic, contextual, and halo variables, you'll set a Positive, Negative, or Neutral impact during model creation.
Check your file before you upload it
A clean header row and a consistent time series save you the back-and-forth of failed mappings and validation errors.
File and header rules
- Save the file as CSV. The upload accepts files up to 50 MB.
- Include one header row.
- Use unique, descriptive column names.
- Remove blank rows and blank columns.
- Avoid columns that contain only zeros.
Date and time rules
- Format every date as
YYYY-MM-DD. - Use one consistent frequency: daily, weekly, or monthly.
- Don't skip expected dates within the selected frequency.
- For weekly data, use a consistent week start day.
- For monthly data, use the first day of each month.
- Include enough history to capture trend, seasonality, and changes in media activity. Two years of daily or weekly data is a useful starting point, and monthly models generally need longer.
Data value and integrity rules
- Use numeric values for spend, impressions, clicks, and KPI fields.
- Don't include currency symbols or thousands separators in numeric cells.
- Don't leave numeric values blank. Use
0when the activity didn't happen. - Use
1and0for binary event variables such as a promotion flag. - Keep the data type consistent within each column.
- Confirm that each paid row has a channel and a spend column.
Give the model enough data to separate one channel from another
A model needs enough observations for the number of parameters it estimates. Each media channel with adstock (how long a channel's impact carries over after spend) and saturation applied contributes several fitted parameters rather than one, and trend and seasonality components add more.
A model with 10 media channels and 15 other variables is estimating well over 50 quantities, not 25.
As a practical minimum, keep at least four observations for every fitted parameter counted this way. It's easier to think about in calendar time than in rows: two years of weekly data is the working target and one year is the minimum, since separating yearly seasonality from trend takes two full cycles.
One hundred daily observations covers roughly three months and won't support a model, however good the ratio looks.
Sample size alone doesn't identify coefficients. Independent variation in spend does. Two channels that move together for 200 weeks are no more separable than they'd be at 20.
Before you rely on a fit, review the coefficient of variation for each channel, the pairwise correlation between channel spends, and the number of distinct spend regimes each channel shows. A channel whose spend never varies stays unidentified at any sample size.
Upload your file and map your variables
- Select Models from the sidebar and click
Create Model. - In the Variables step, choose Upload a CSV.
- Select the date column and map the Outcome KPI.
- Add your paid, organic, contextual, and halo variables.
- Review any unused fields before proceeding.
If something goes wrong
If the file can't be read, confirm that it's a CSV with a valid header row and below the upload limit. For missing data, unusual time series, or questions about which variables to include, contact your Lifesight Marketing Science team before replacing values or removing fields.
Frequently Asked Questions
Do I have to upload a CSV to build a model?
No. You can create a model from an existing Data Model instead. Upload a CSV when you want to map every field manually.
Is there a template I can start from?
Yes. Use the MMM CSV sample template linked at the top of this page.
Which columns are mandatory?
A date column in YYYY-MM-DD format, at least one KPI column such as revenue, orders, installs, or new customers, and at least one numeric paid media spend field.
Do I need impressions and clicks for every channel?
No. The variable mapper needs only a channel and a spend field for every paid row. Tactic, impressions, and clicks are optional, though including them is recommended.
What other columns should I include?
Organic signals such as sessions, direct traffic, and email activity, contextual variables such as promotions, pricing changes, holidays, weather, competitor activity, and macro indicators, halo variables for spillover effects, and dimensions such as country, region, or product if you want dimensional child models.
What is a halo variable?
A cross-channel or cross-product variable that represents spillover, where activity in one channel or product influences another.
What does the Positive, Negative, or Neutral impact setting do?
You set it during model creation for organic, contextual, and halo variables, to tell the model the direction of effect you expect from each one.
How large can my file be?
Up to 50 MB, saved as a CSV.
What date format does the file need?
Every date must be formatted as YYYY-MM-DD.
Can I mix daily and weekly rows in one file?
No. Use one consistent frequency throughout. For weekly data, keep the same week start day. For monthly data, use the first day of each month.
What should I do about gaps in my data?
Don't skip expected dates within your chosen frequency, and don't leave numeric values blank. Use 0 where the activity didn't happen.
How should I format numbers?
Use plain numeric values with no currency symbols or thousands separators, and keep the data type consistent within each column.
How do I record a promotion or other one-off event?
Use a binary variable with 1 and 0 values, such as a promotion flag.
How much history do I need?
Two years of weekly data is the working target and one year is the minimum, because separating yearly seasonality from trend takes two full cycles. Monthly models generally need longer.
Is 100 daily rows enough?
No. That covers roughly three months, which can't support a model regardless of how the data-to-feature ratio appears.
How many observations do I need per variable?
At least four for every fitted parameter. Count parameters rather than columns: each media channel with adstock and saturation contributes several, and trend and seasonality components add more. Ten media channels and 15 other variables means well over 50 fitted parameters, not 25.
Will more data always improve my model?
No. Independent variation in spend is what identifies coefficients, not sample size. Two channels that move together for 200 weeks are no more separable than at 20, and a channel whose spend never varies stays unidentified at any sample size.
What should I check before relying on a fit?
Review the coefficient of variation for each channel, the pairwise correlation between channel spends, and the number of distinct spend regimes each channel shows.
Where do I upload the file?
Select Models from the sidebar, click Create Model, and choose Upload a CSV in the Variables step. Then select the date column, map the Outcome KPI, add your variables, and review any unused fields before proceeding.
My file won't upload. What should I check?
Confirm that it's a CSV with a valid header row and below the 50 MB limit.
What if I have missing data or unusual patterns in my time series?
Contact your Lifesight Marketing Science team before replacing values or removing fields.
Related Articles
Updated about 2 hours ago