
Build a Time Testing Experiment
Find out what a channel truly drives, without splitting by region.
A time test in Lifesight has four steps: Setup, Data, Design and Review. In Setup, you pick the channel, the KPI, and whether to pause, cut or raise spend. In Data, you upload your KPI history. Design shows the smallest lift the test can detect and how long it should run. Review lets you check every setting before the test starts.
Once the test is live, you make the spend change in the channel yourself. Lifesight compares the results with a baseline built from your history. When the test ends, you get the channel’s lift, incremental revenue and iROAS. Use them to decide whether to keep, cut or grow its budget.
When to use a time test
| Your situation | Best fit | Why |
|---|---|---|
| The channel can't be split by region | Time test | National TV, radio, podcasts, influencer and sponsorships run everywhere at once, so there is no control region. |
| You have too few regions | Time test | Geo tests need about 20 or more comparable regions. Single-country and smaller brands often have fewer. |
| Regional targeting is unreliable | Time test | A time test needs no regional split, so location targeting and spillover between regions don't affect it. |
| The channel can be split by region and you have enough regions | Geo test | A control group running at the same time removes seasonality and other events from the comparison. This gives the strongest read. |
| The test window overlaps a sale, launch, price change or peak season | Geo test, or move the time test | A time test counts any other change in the window as lift. |
| You want to split budget across all channels | MMM, calibrated with test results | Tests measure one channel at a time. MMM covers all channels and uses test results to sharpen its estimates. |
Note: A time test is not a replacement for a geo test. Without a control group running at the same time, the result depends on the forecast. When a channel and market allow a geo test, run one. When they don't, a time test in a normal period gives you a measured answer instead of a guess.
Before you begin
Here are few things you would need before you being creating a time test:
- One KPI to measure, such as revenue, orders, conversions, sign-ups, leads or app installs.
- One channel to test, where you control spend on specific dates.
- A history file (CSV) with your KPI at daily or weekly level.
- A normal period to run the test, away from sales, launches, price changes and peak season.
How much history
| Granularity | Minimum | Recommended | Maximum used |
|---|---|---|---|
| Daily | 56 days | 15 months | 24 months |
| Weekly | 16 weeks | 15 months | 24 months |
Fifteen months lets the forecast learn a full year of seasonality plus your recent trend. The more history, the steadier the baseline. Monthly data is not supported.
File format
Your CSV needs a header row and one row per date.
| Column | Required | What it holds | Example |
|---|---|---|---|
| Date | Yes | One row per day or per week. No gaps, same spacing throughout. | 2026-01-05 |
| KPI | Yes | The outcome you want to measure, as a number. | 48250 |
| Spend | Optional | Spend on the test channel for that day or week. Used to read spend before the change and to calculate iROAS. | 6200 |
Example file:
| date | revenue | spend |
|---|---|---|
| 2026-01-05 | 48250 | 6200 |
| 2026-01-12 | 51100 | 6400 |
| 2026-01-19 | 49870 | 6100 |
Before you upload, check that:
- Every date between the first and last row is present.
- All rows use the same spacing (every day, or every week on the same weekday).
- KPI and spend cells hold numbers only. No currency symbols, text or blanks.
- The last row is recent. The test is planned from the latest date in your file.
Create a time test
Open Time Testing
- Go to Measurement > Experiments.
- Click New Experiment.
- Under How do you want to test?, choose Time Testing.
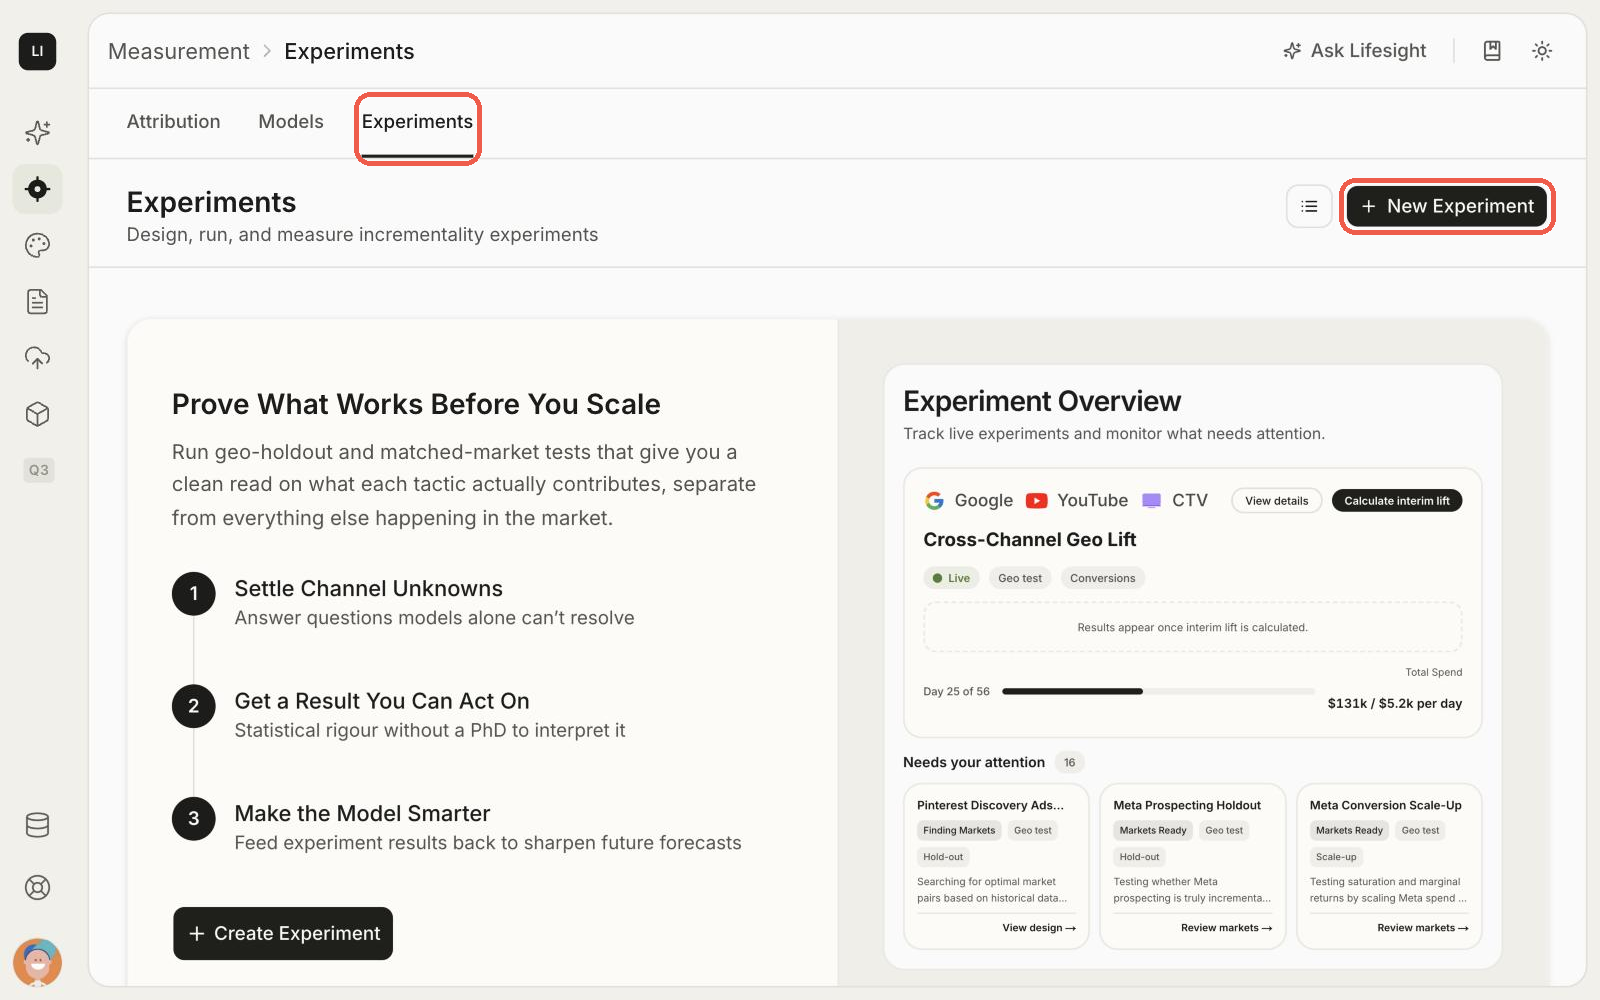
Experiments page with the New Experiment button
Tip: Find your time tests. On the Experiments page, use the All tests / Geo / Time filter to see only your time tests.
Step 1: Setup
Tell Lifesight what you want to learn.
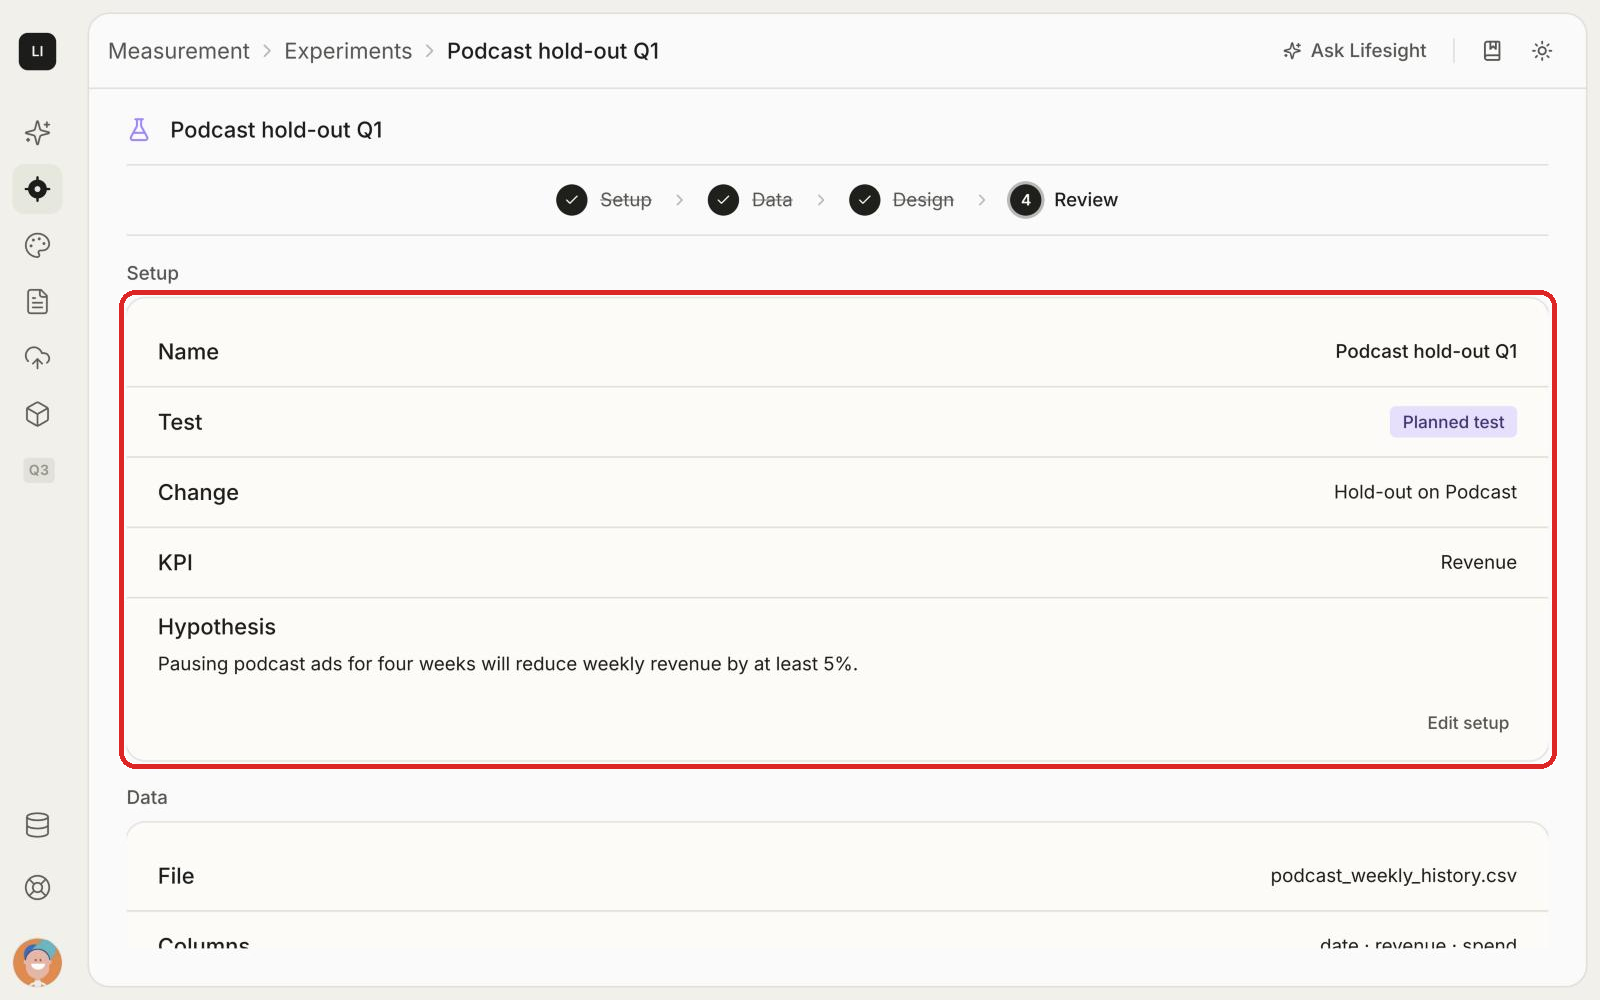
- Name: give the test a name that is unique among your time tests, for example "Podcast hold-out Q1".
- What do you want to do? Choose Plan a new test. This changes spend from a future date and measures what it did.
- Hypothesis: under What do you expect to happen?, write the result you expect. For example: "Pausing podcast ads for four weeks will reduce weekly revenue by at least 5%."
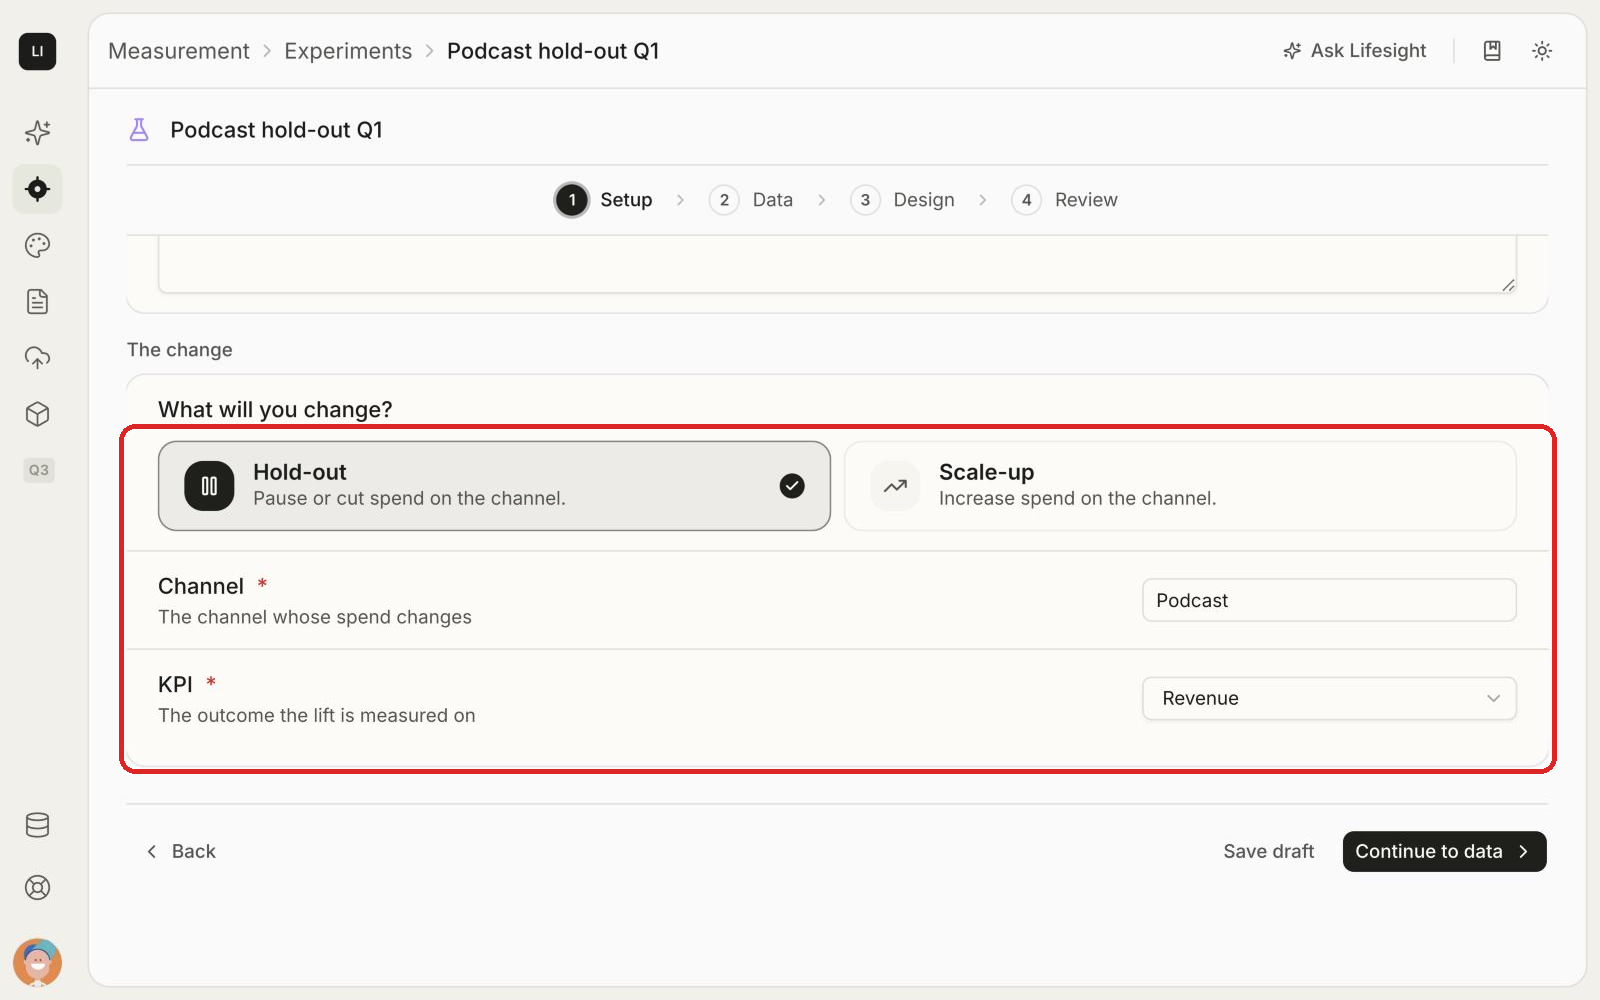
- What will you change? Choose Hold-out (pause or cut spend) or Scale-up (increase spend).
- Channel: enter the channel whose spend changes, for example Meta, TV or OOH.
- KPI: choose the outcome the lift is measured on, for example Revenue.
- Click Continue to data.
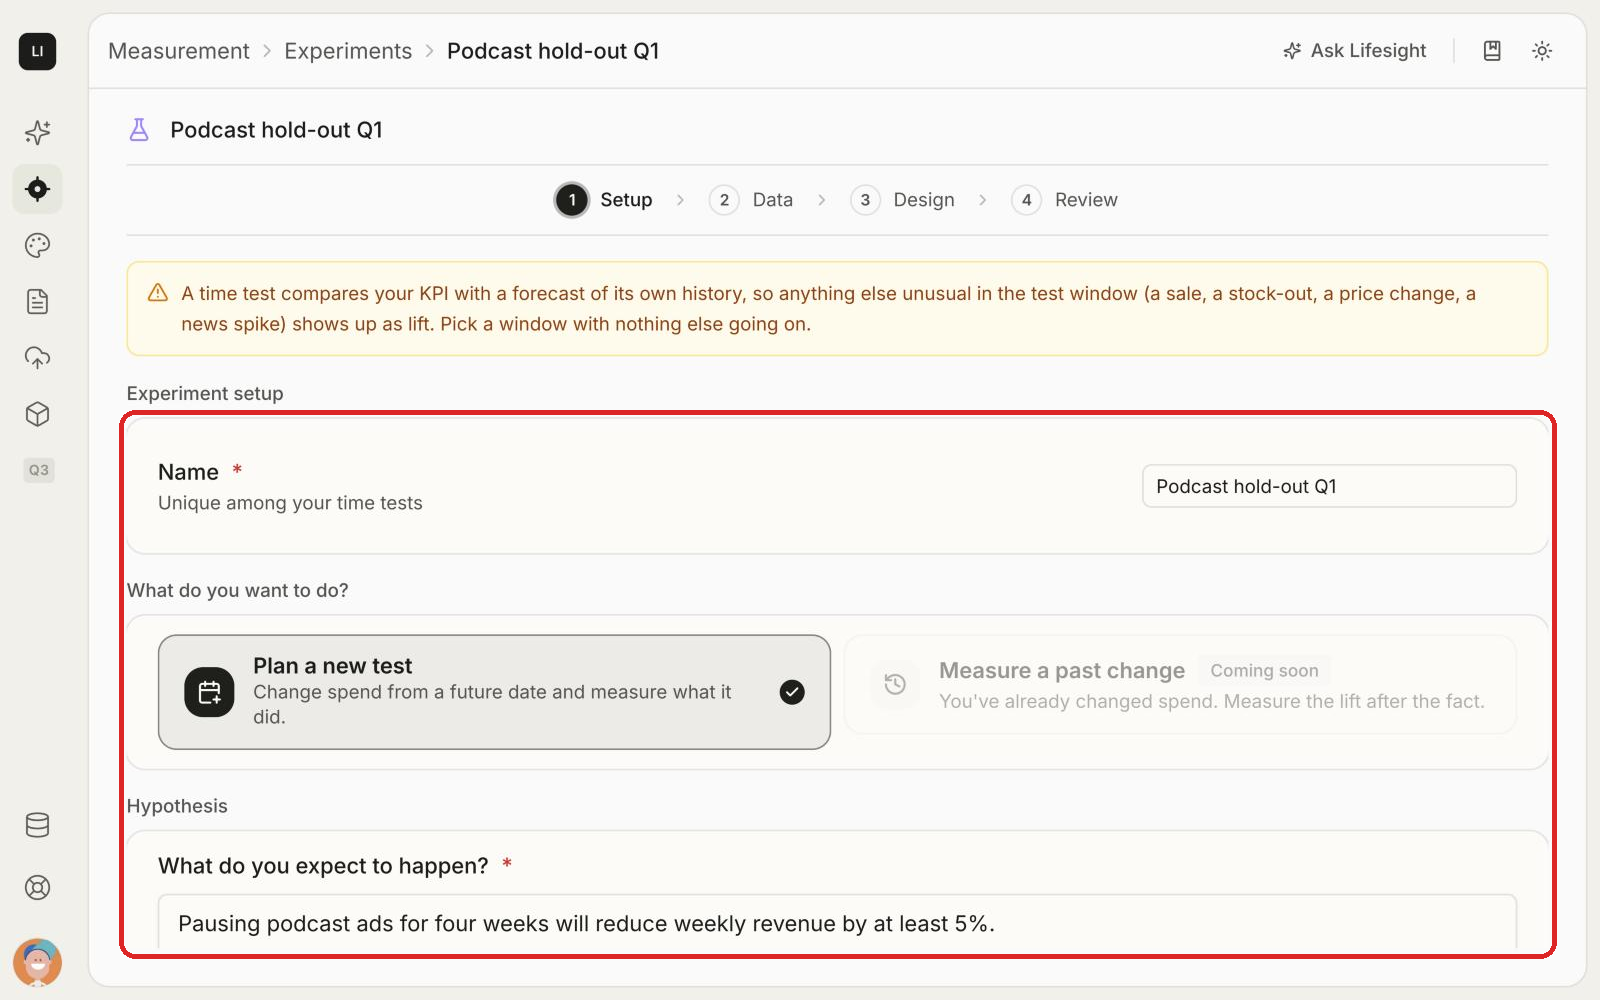
Warning: Pick a quiet window. A time test compares your KPI with a forecast of its own history. Anything else unusual in the test window, such as a sale, a stock-out, a price change or a news spike, shows up as lift. Pick a window with nothing else going on.
Step 2: Data
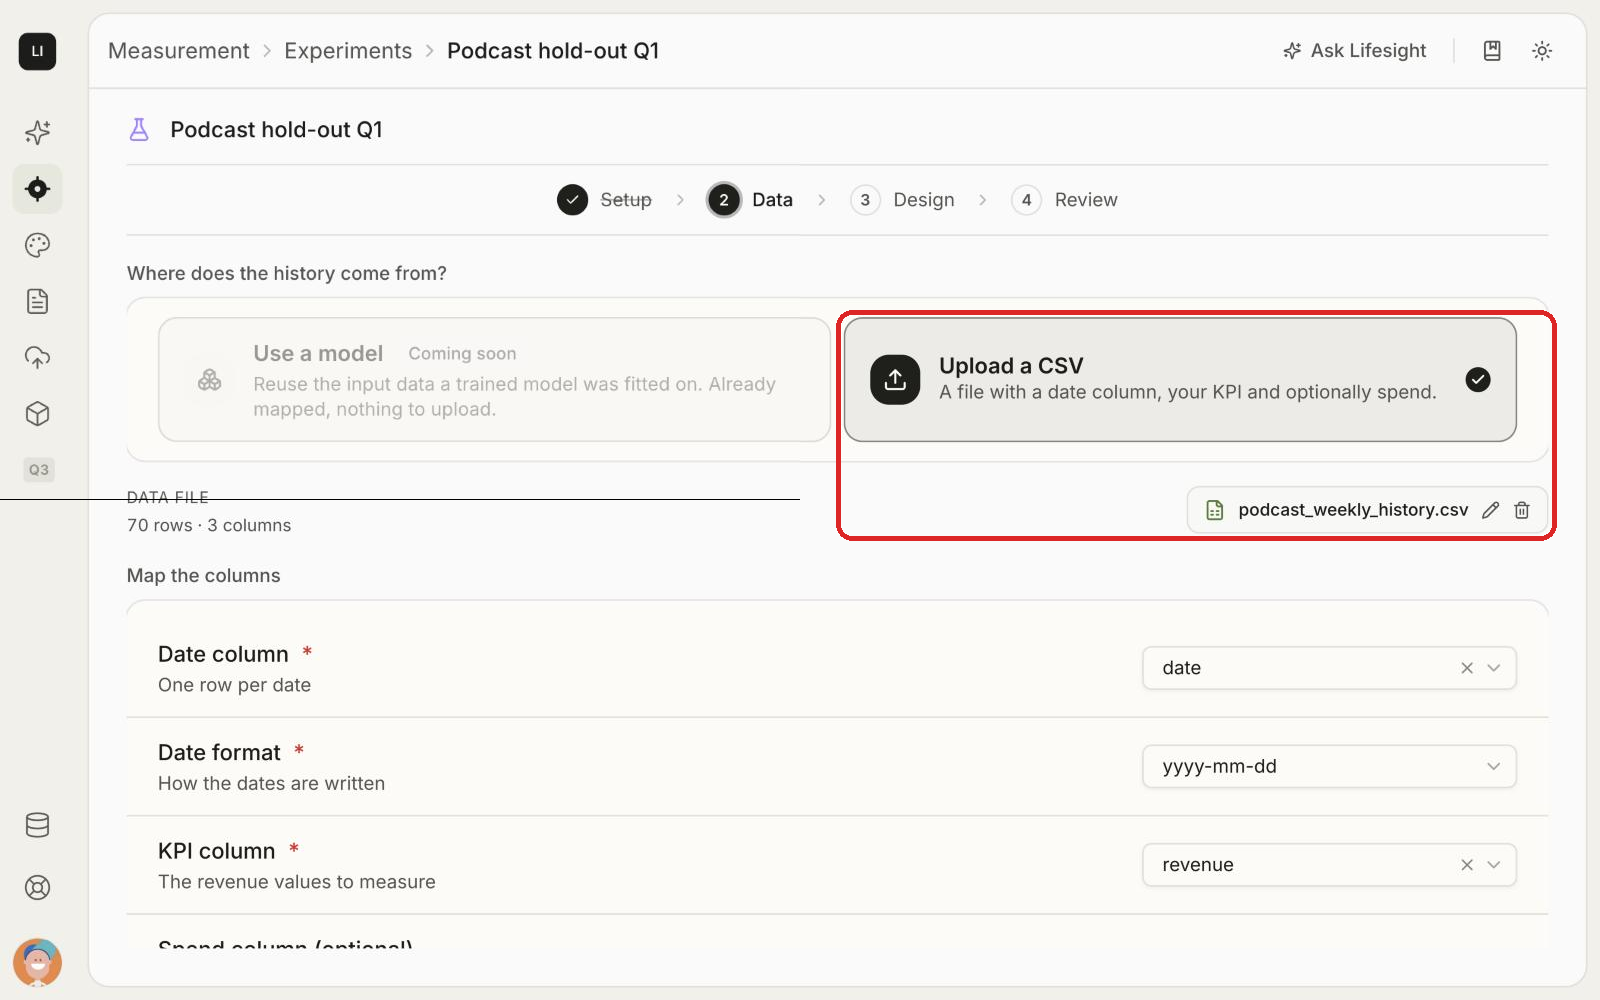
Upload your KPI history and map its columns.
- Under Where does the history come from?, choose Upload a CSV.
- Click Upload a CSV and select your file. Lifesight shows the file name, the number of rows and the number of columns.
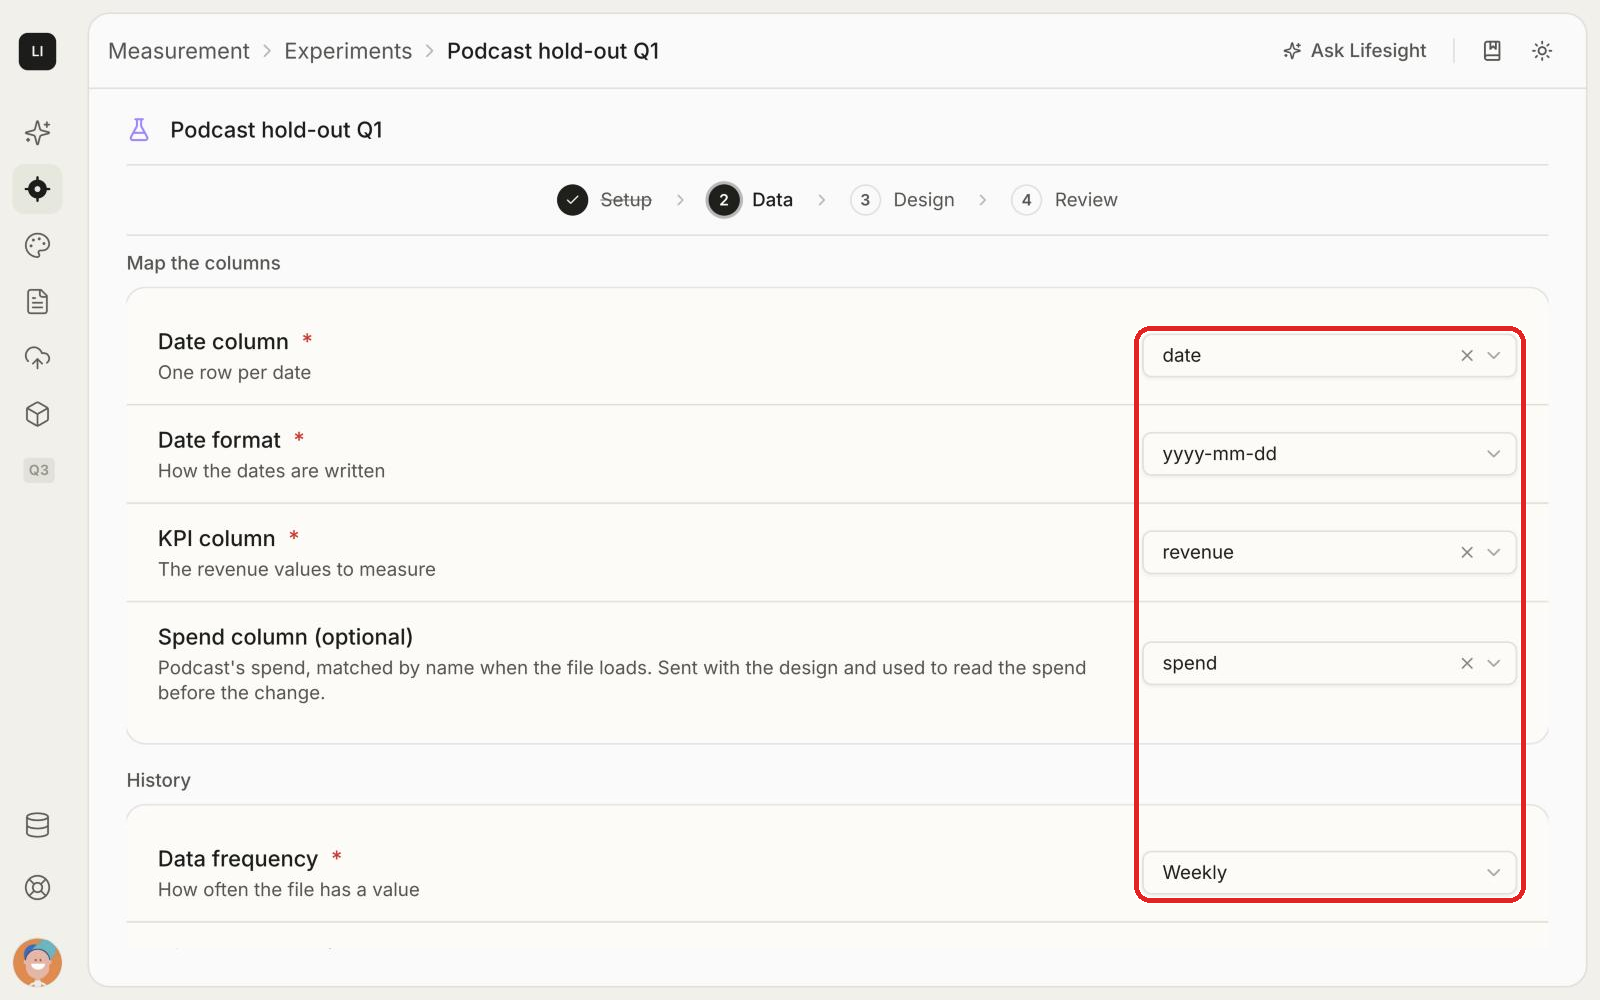
- Under Map the columns, set:
- Date column: the column with one row per date.
- Date format: how the dates are written, for example yyyy-mm-dd.
- KPI column: the column with the values to measure.
- Spend column (optional): the channel's spend. It is used to read the spend before the change.
- Under History, set:
- Data frequency: Daily or Weekly.
- History to learn from: how far back to learn, counted from the latest date in your file. 15 months is the default.
- Click Validate.
[Image 6: image-06-data-map-columns.png]
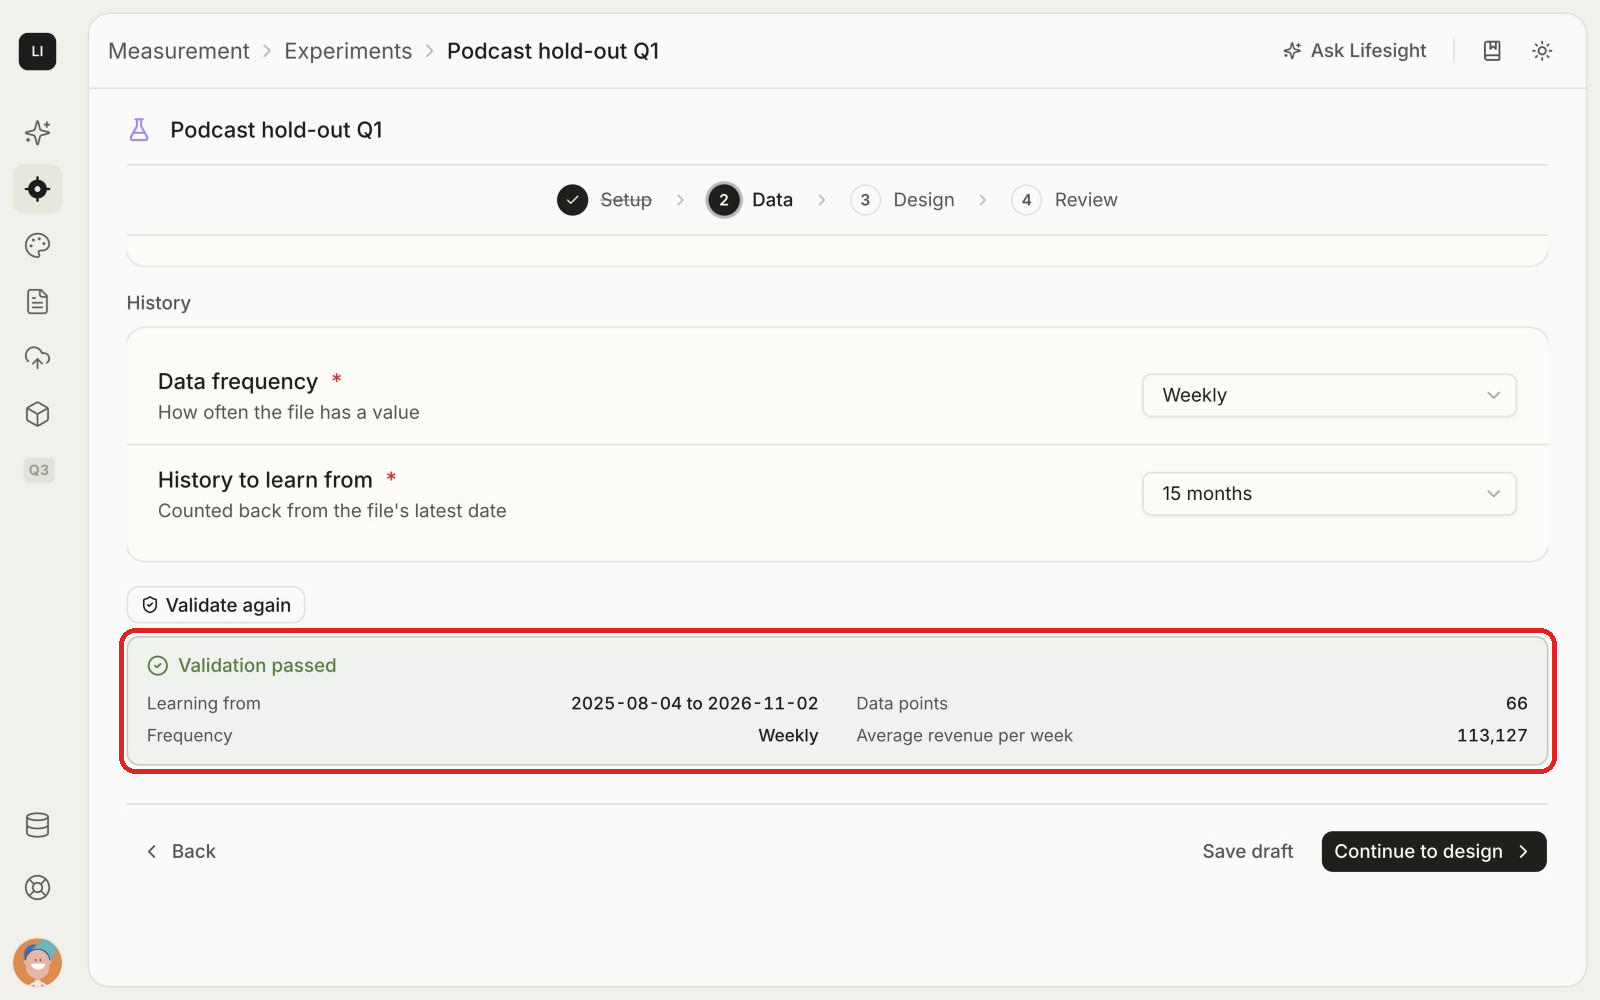
When the file passes, you'll see Validation passed with a summary:
- Learning from: the date range used to build the baseline.
- Data points: how many rows fall in that range.
- Frequency: daily or weekly.
- Average KPI per period: for example, average revenue per week.
If the file doesn't pass, Lifesight tells you which row to fix. Fix the file, upload it again and click Validate again.
Then click Continue to design.
Step 3: Design
Size the test before any budget moves.
Test length
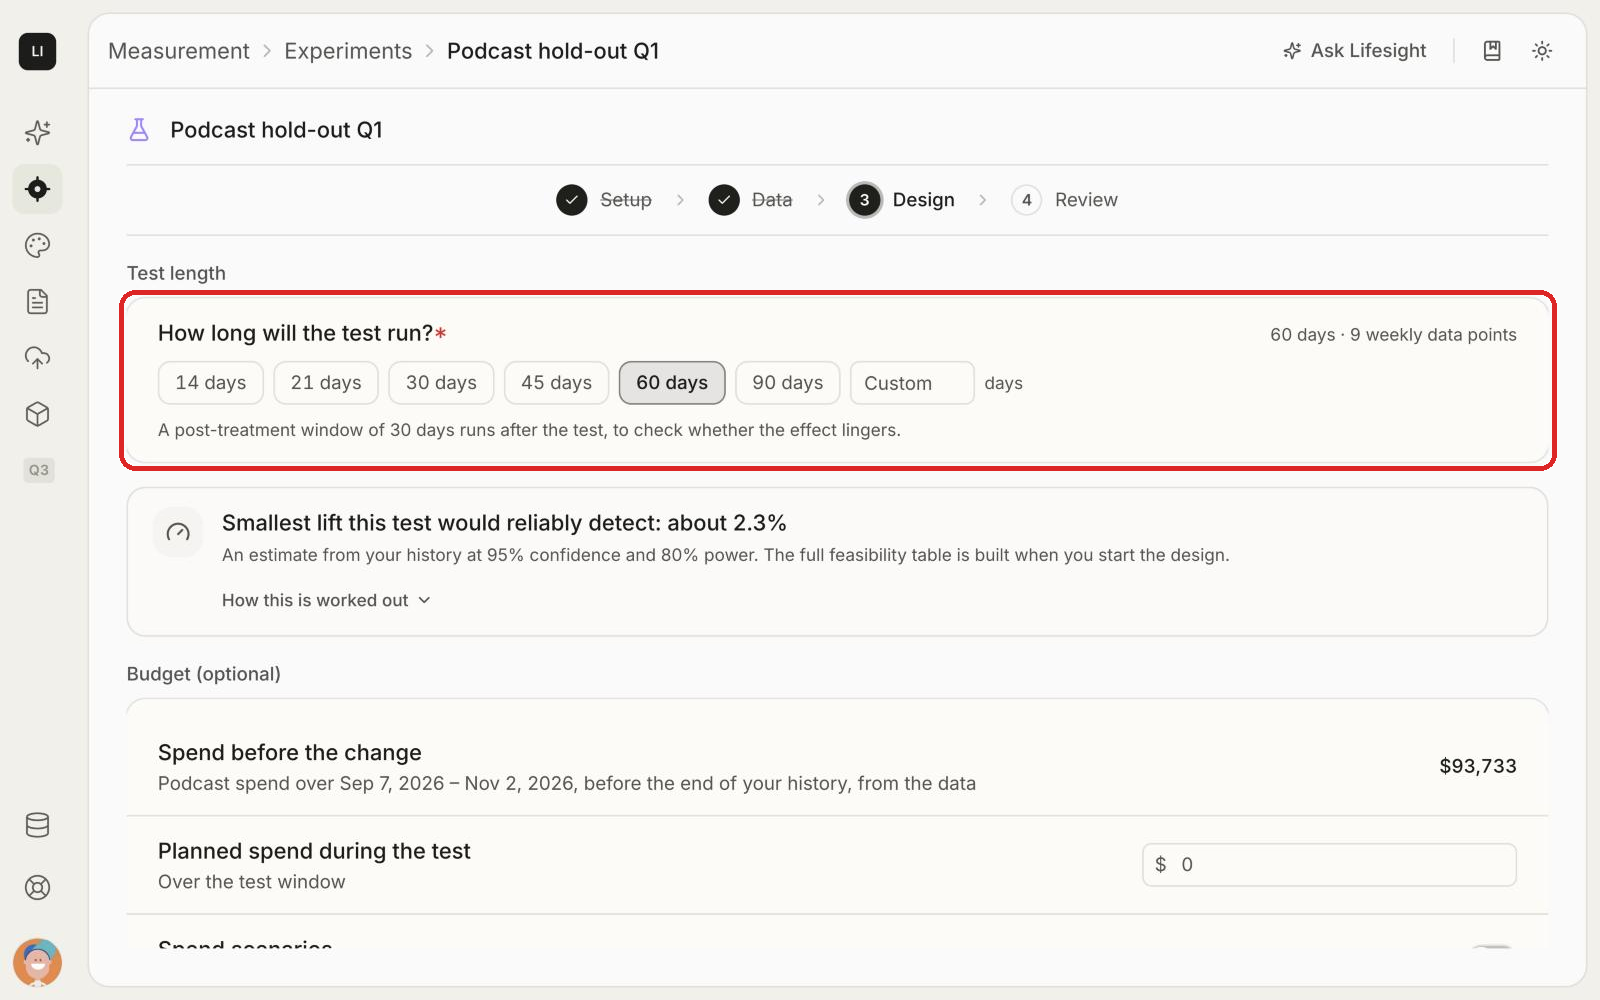
Under How long will the test run?, choose 14, 21, 30, 45, 60 or 90 days, or enter a Custom number of days. Lifesight shows how many data points fall in the test window.
Lifesight adds a post-treatment window after the test, to check whether the effect lingers. For example, a 60-day test gets a 30-day post-treatment window.
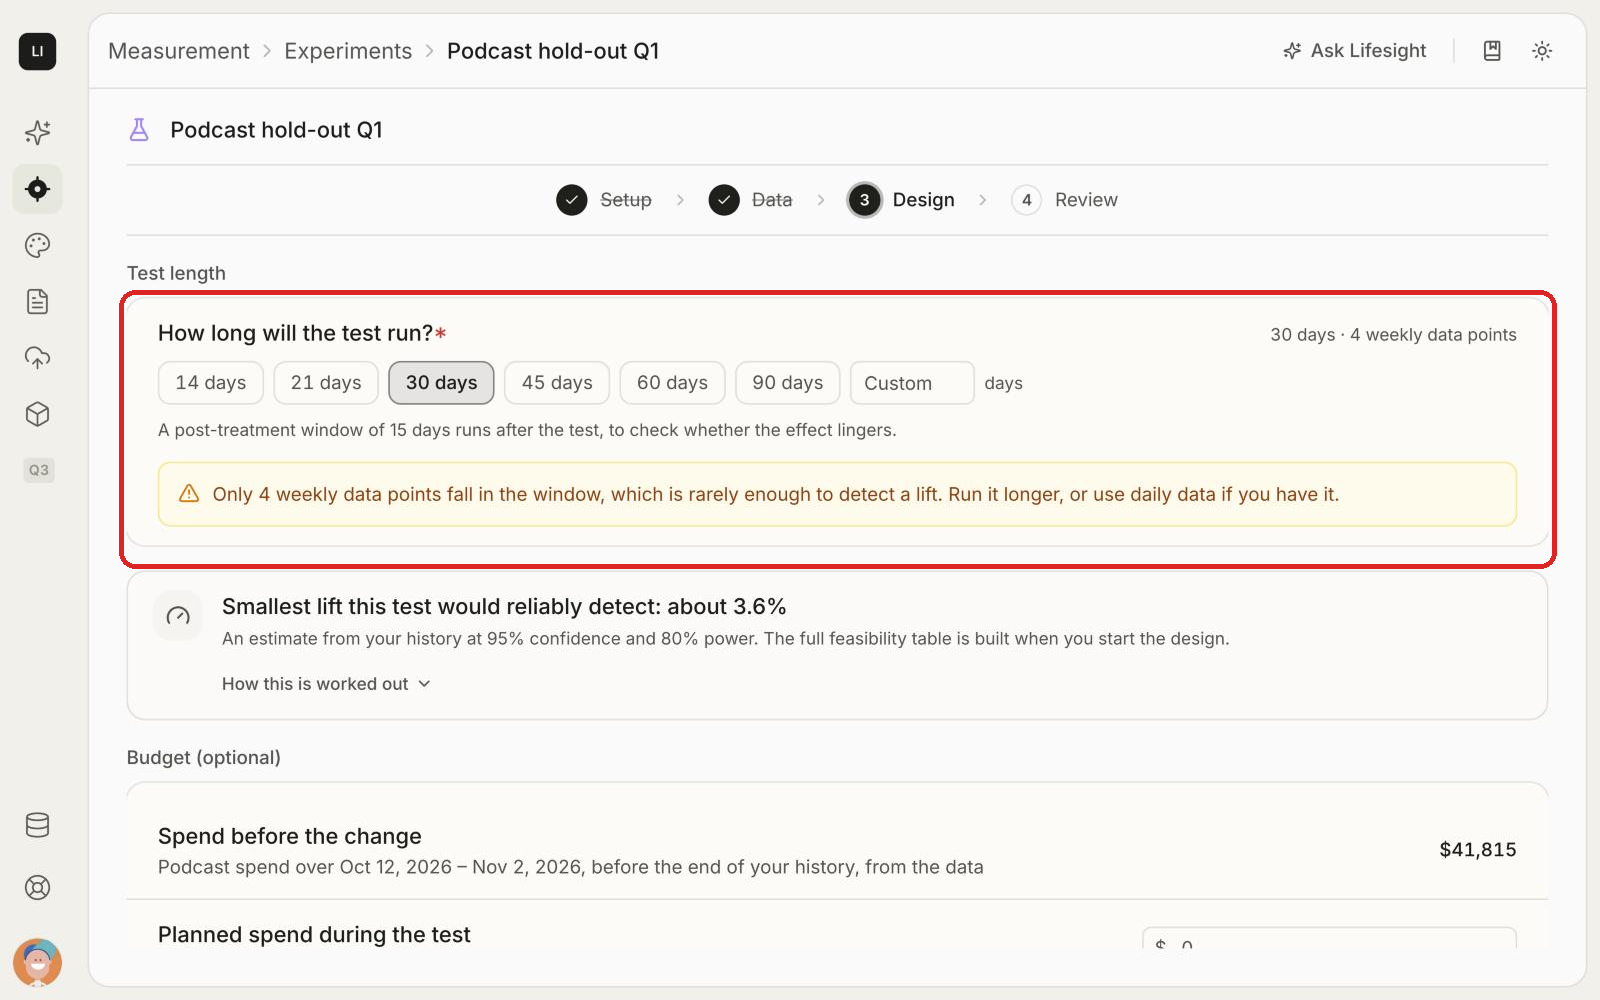
If too few data points fall in the window, Lifesight warns you. Run the test longer, or use daily data if you have it.
Smallest detectable lift
Lifesight shows the smallest lift this test would reliably detect, estimated from your history at 95% confidence and 80% power. A lift that size is detected 8 times in 10.
Click How this is worked out to see the inputs:
- Baseline: the average KPI per period over recent history.
- Variation: how much the KPI typically moves from period to period.
- Test data points: the number of periods in the test window.
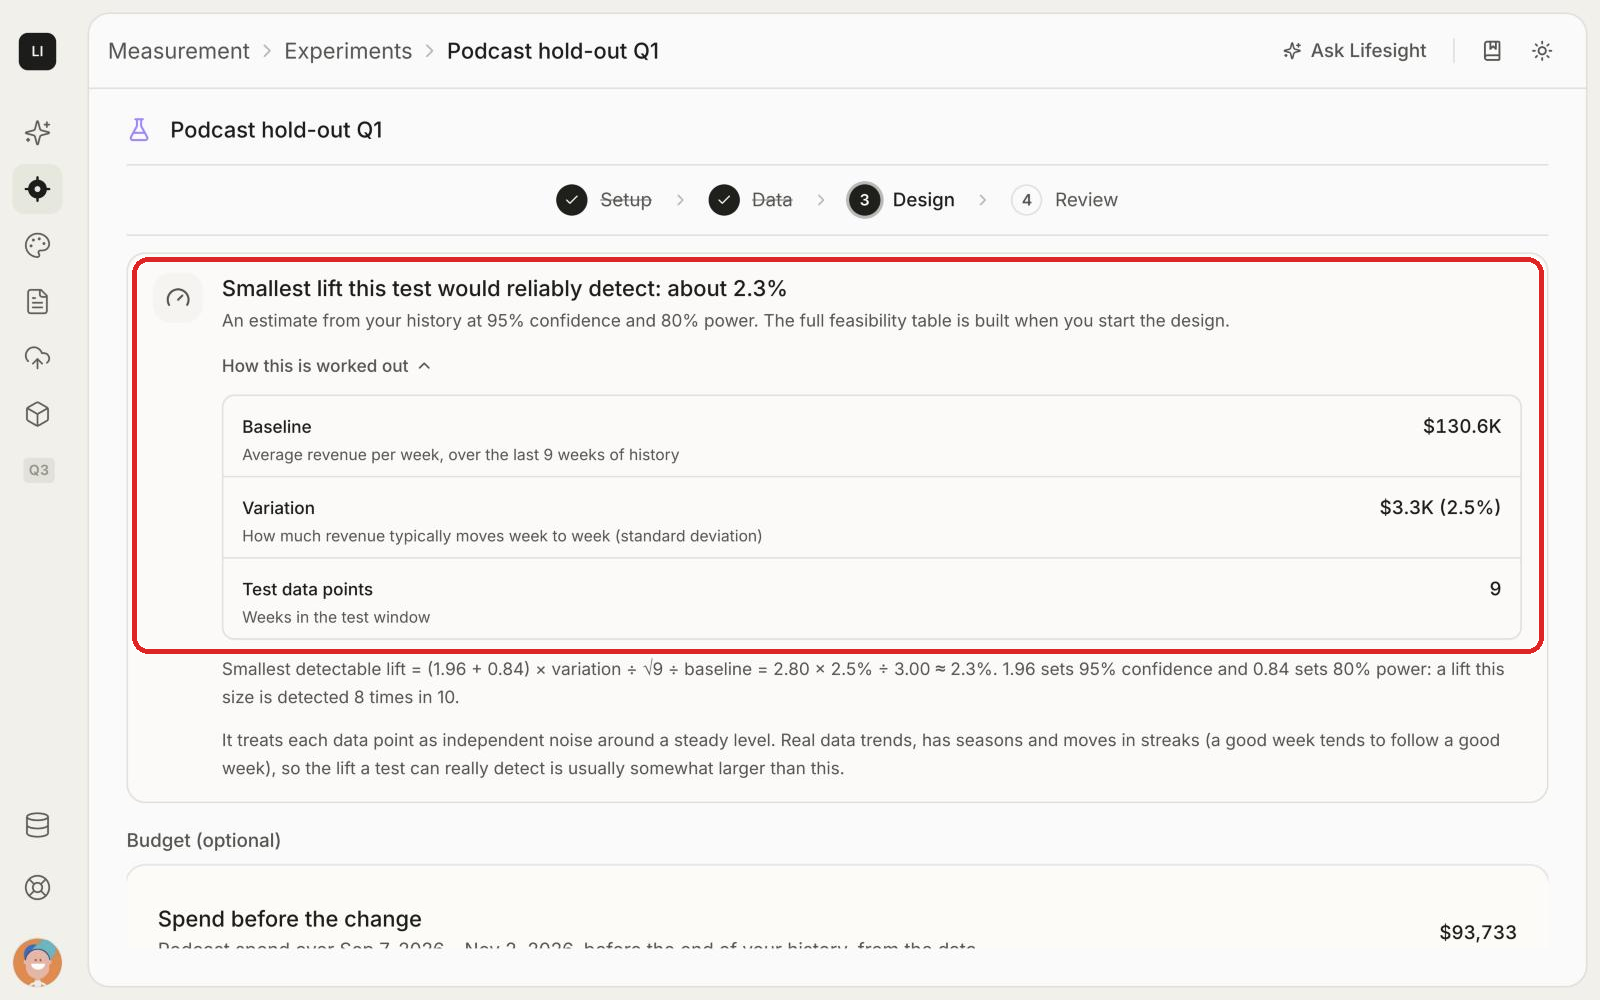
Note: Check the detectable lift against your hypothesis. If you expect a 5% drop and the test can detect 2.3%, the test is well sized. If the detectable lift is bigger than the effect you expect, run the test longer or make a bigger spend change. Real data has trends and streaks, so the lift a test can really detect is usually somewhat larger than this estimate.
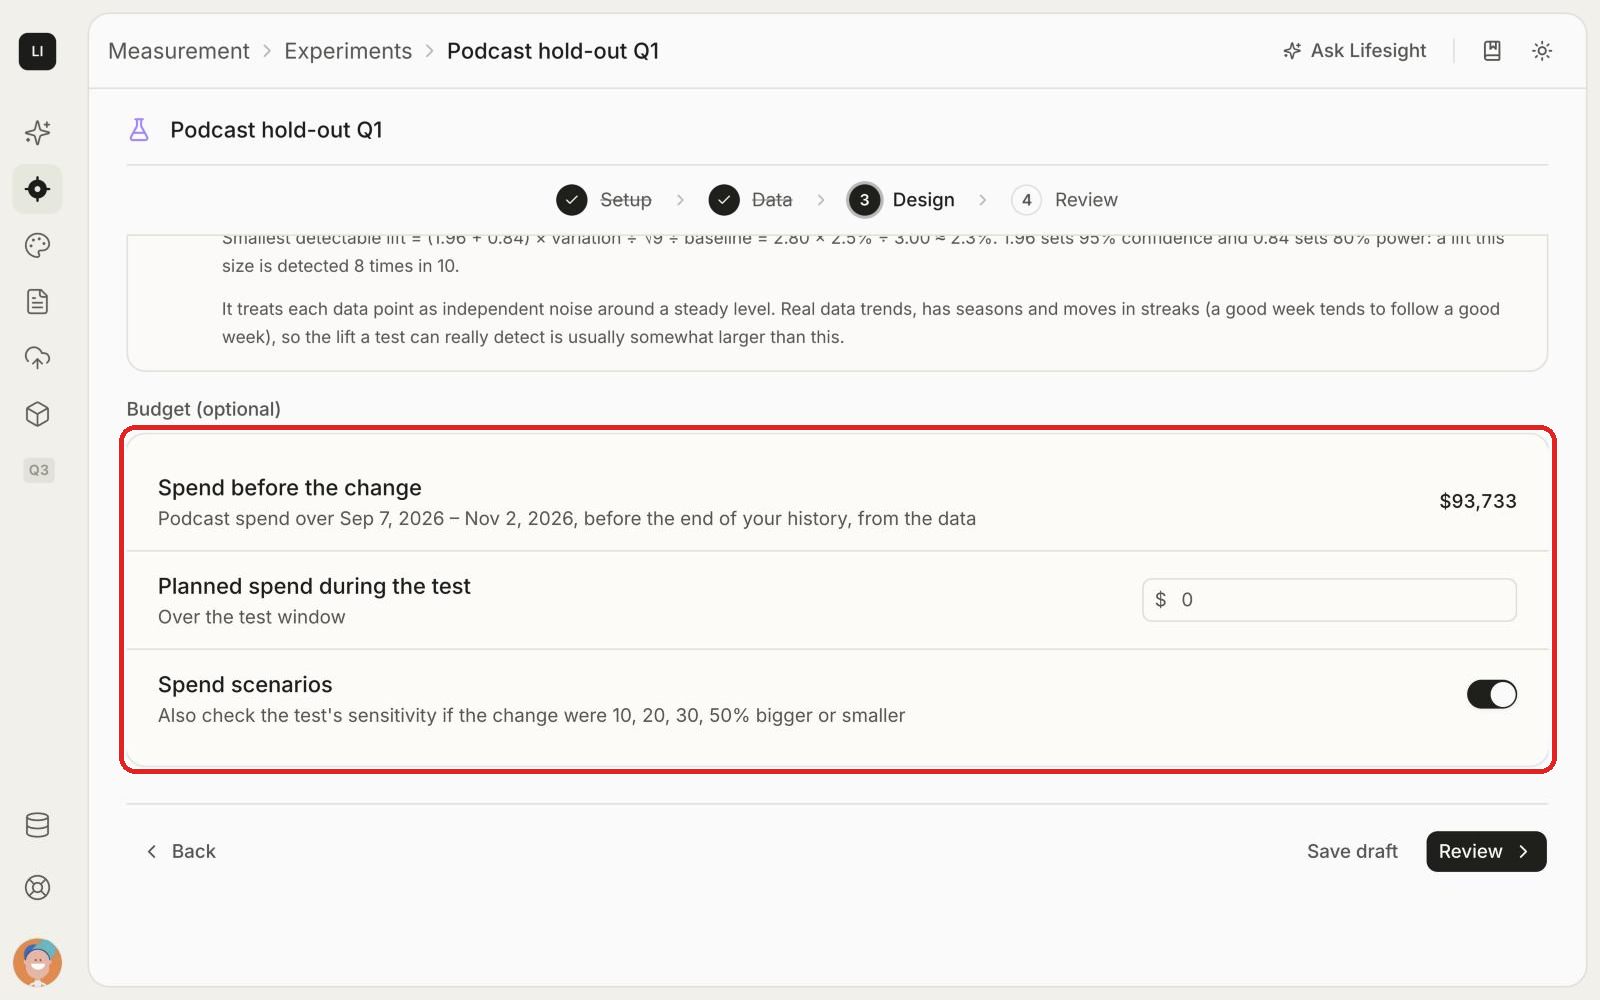
Budget (optional)
- Spend before the change: Lifesight reads the channel's spend from your file for the period before the test.
- Planned spend during the test: enter what you plan to spend over the test window. For a full pause, enter 0.
- Spend scenarios: turn this on to also check the test's sensitivity if the change were 10%, 20%, 30% or 50% bigger or smaller.
Click Review.
Step 4: Review
Check the summary of your Setup, Data and Design. Use Edit setup, Edit data or Edit design to change anything.
Click Start design when you're ready. You can also click Save draft to come back later.
Run the test
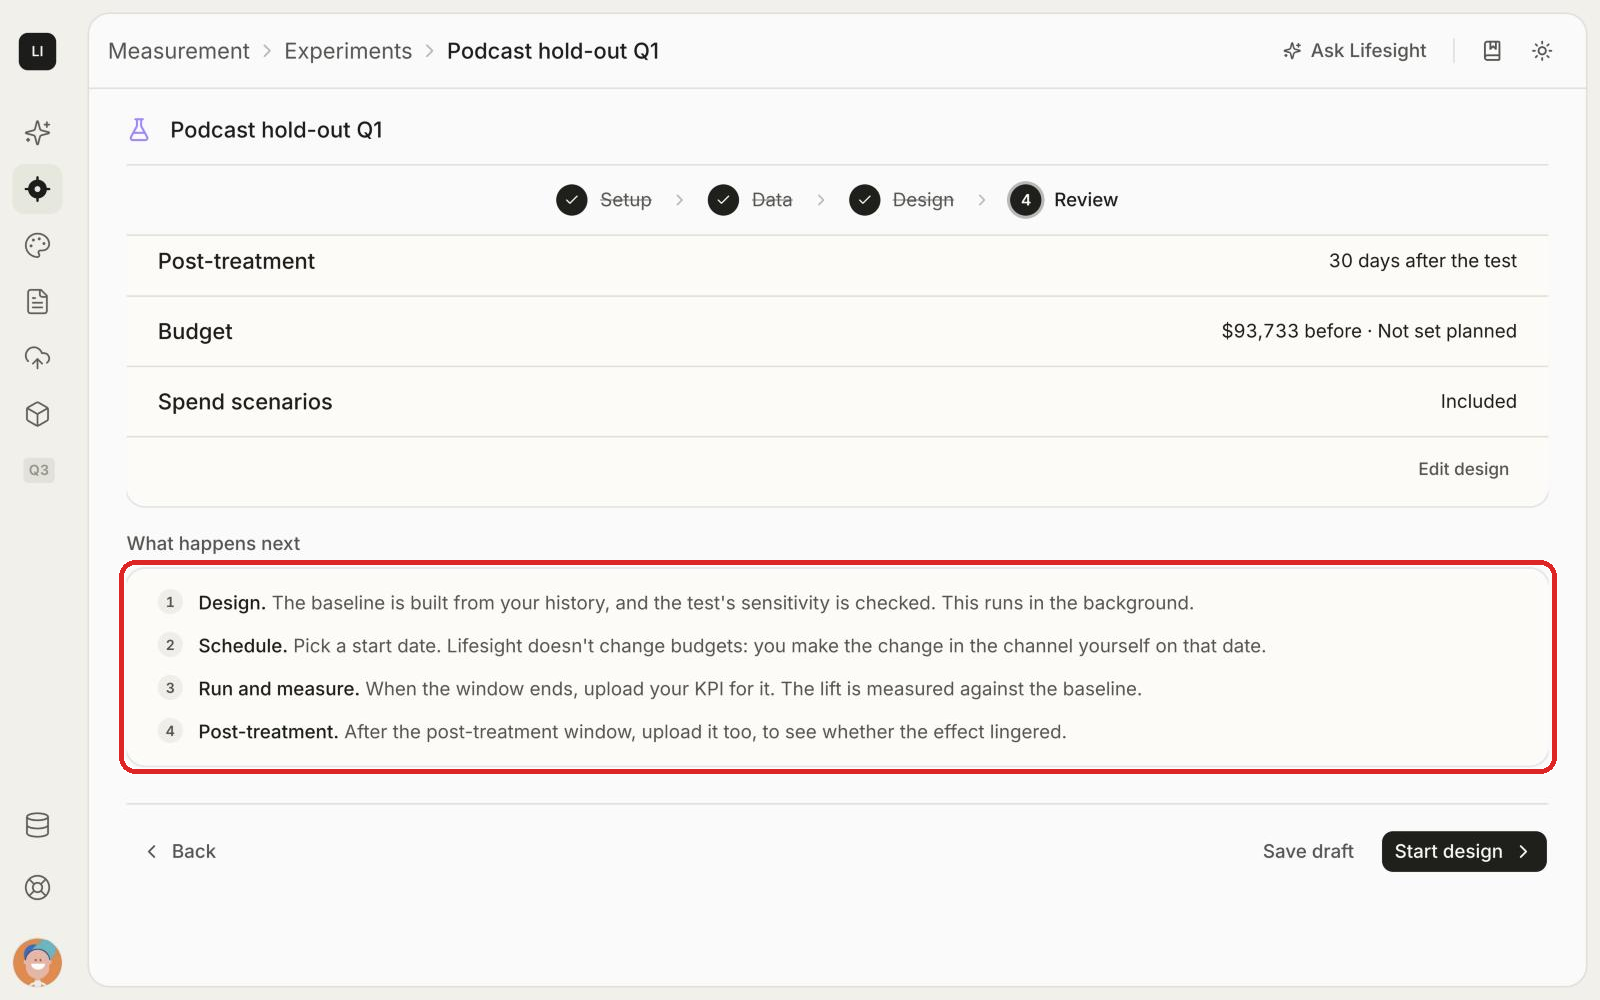
After you start the design, the test moves through four stages.
- Design. Lifesight builds the baseline from your history and checks the test's sensitivity. This runs in the background.
- Schedule. Pick a start date. Lifesight doesn't change budgets. You make the change in the channel yourself on that date.
- Run and measure. When the test window ends, upload your KPI for it. Lifesight measures the lift against the baseline.
- Post-treatment. After the post-treatment window, upload that data too, to see whether the effect lingered.
Keep the test window clean
- Keep the change steady. Don't switch the channel back on early or change the amount mid-test.
- Keep other channels steady. A budget shift elsewhere shows up as lift on the test channel.
- Avoid promotions and launches. Sales, new products, price changes and stock-outs all move the KPI.
- Log anything unexpected, such as a PR mention, an outage or a competitor promotion. It helps you read the result later.
Get results you can act on
When you upload the KPI for the test window, Lifesight shows:
- Lift: how far the KPI moved from the baseline during the test.
- Incremental KPI: the extra (scale-up) or lost (hold-out) revenue, orders or conversions.
- iROAS and cost per incremental result: when you include spend.
- Verdict: significant lift, significant drop, or inconclusive.
- Readout: a plain-language summary of what the result means for the channel.
- Post-treatment effect: whether the impact continued after spend returned to normal.
How to read the verdict
- Significant drop in a hold-out: the channel was driving results. Pausing it cost you the incremental KPI shown. Weigh that against the spend you saved.
- Significant lift in a scale-up: extra spend brought extra results. Compare the iROAS with your target to decide whether to keep the higher budget.
- Inconclusive: the KPI didn't move further from the baseline than normal variation. This does not mean the channel has no effect. The effect may be smaller than the test could detect. Run a longer test, or make a bigger spend change.
Where results go next: use the result to adjust the channel's budget, and to check your MMM's estimate for the channel. You can enter the result into your MMM manually to calibrate it.
Best practices
- Test one channel at a time. Two changes in one window can't be separated.
- Use 15 months of history so the baseline covers a full year of seasonality.
- Check the smallest detectable lift first. Only run the test if it is smaller than the effect you expect.
- Make a meaningful change. A pause or a large cut is easier to detect than a 10% change.
- Use daily data for short tests. More data points in the window make smaller lifts detectable.
- Pick a quiet period. Avoid holidays, peak season, sales and launches.
- Include spend to get iROAS and cost per incremental result.
Frequently Asked Questions
Are time tests as reliable as geo tests?
No. A geo test has a control group running at the same time, so it removes seasonality and other events from the comparison. A time test depends on the baseline forecast. Use a geo test when the channel and market allow one, and a time test when they don't.
How much history do I need?
At least 16 weeks of weekly data or 56 days of daily data. We recommend 15 months. Up to 24 months is used.
Can I use monthly data?
No. Time tests support daily and weekly data.
How long should my test run?
Between 7 and 180 days. The Design step shows the smallest lift your chosen length can detect, and warns you if the window has too few data points.
Does Lifesight change my budgets?
No. You make the spend change in the channel on the scheduled start date.
What can break a time test?
Anything else that changes the KPI in the window: a sale, a launch, a price change, a stock-out, news coverage, or another channel's budget changing.
Why is my result inconclusive?
The KPI didn't differ from the baseline by more than normal variation. The channel may still have an effect that is smaller than the test could detect. Try a longer test, daily data, or a bigger spend change.
Can I measure a spend change that already happened?
Not yet. Measure a past change is coming soon. Today, time tests are planned before the spend change.
Can I use my model's data instead of uploading a file?
Not yet. Use a model is coming soon. Today, time tests use an uploaded CSV.
Does a time test result update my MMM automatically?
Not today. You can enter the result into your MMM manually to calibrate it.
Updated about 20 hours ago