Split Testing : Statistical Significance
Why Statistical Significance?
When you're running a marketing campaign, you're looking at metrics (like clicks, conversions, or sales) to see how it's doing. But just looking at these numbers doesn't always tell you if the campaign is truly working, especially when you're trying to decide if you should keep investing in it or stop altogether.
There are things like small sample sizes (too few people), big outliers (extreme results that don't represent the norm), or other random factors (like people in your control group being on vacation) that can mess with your numbers. These issues can make it hard to know if the campaign's success is real or just random luck.
This is where significance testing comes in. It's a statistical method that helps us figure out if the difference in performance between two groups (like a group that saw your ad vs. a group that didn’t) is real and not just a fluke. It tells you if the improvements you're seeing are likely because of the campaign, and if you can expect similar results in the future if you continue it.
What’s Involved in Significance Testing?
Two main factors determine whether the difference between your groups is statistically significant:
- The size of the difference (effect size): A big difference in performance (like 20% more conversions) makes it more likely that it's real.
- The size of your audience (sample size): The more people in your study, the more confident you can be that the difference isn't due to chance.
If the difference is big, even a small audience might show significance. But with a large audience, even a tiny difference can be meaningful and not just random. (However, just because a small difference is statistically significant doesn’t always mean it’s worth the extra cost!)
Confidence Intervals
Significance testing also uses something called a Confidence Interval. When we talk about a result being statistically significant at a 95% confidence level, it means we’re 95% sure that the difference we observed isn’t just random.
The null hypothesis is the assumption that there’s no real difference between the two groups and that any difference is just chance. Significance testing tries to reject this null hypothesis, showing that the difference is real.
The confidence interval is like a threshold you set for how confident you need to be to reject the null hypothesis. Higher confidence levels (like 95% or 99%) mean you're being more careful, requiring stronger evidence to say that the campaign had a real impact. In marketing, because it's often harder to reach high confidence levels, it's not uncommon to use 90% or even 80% confidence to make decisions.
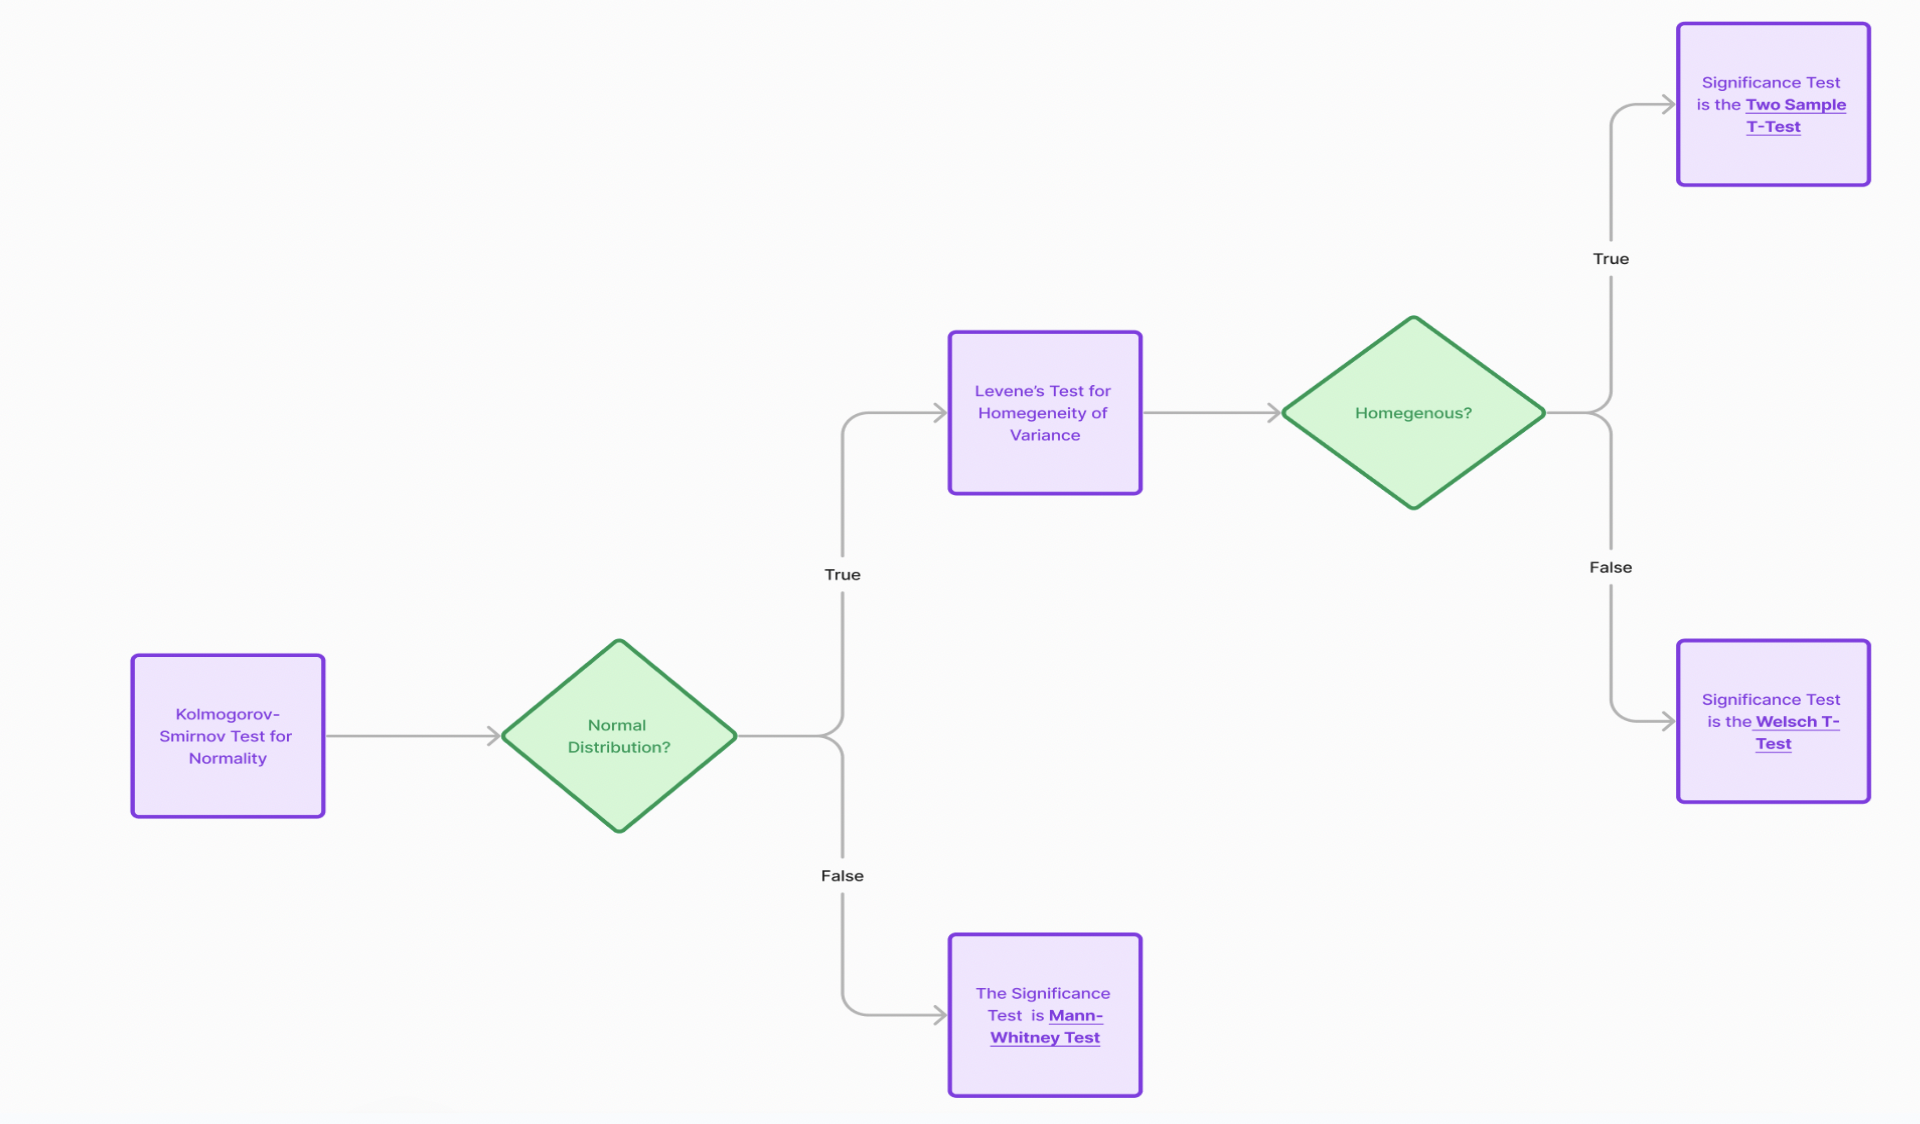
Choosing the Right Significance Test
There are various statistical tests available depending on the data characteristics. Below are the steps used at Lifesight for performing statistical tests in split testing :
-
Check for Normality
- Use the Shapiro-Wilk test to determine if the data for treatments is normally distributed.
-
If Data is Normally Distributed
- Check for Variance between treatment and control groups:
- If the variances are the same, use the Two-Sample t-test to assess statistical significance.
- If the variances are different, use Welch's t-test.
- Check for Variance between treatment and control groups:
-
If Data is Not Normally Distributed
- Use the Mann-Whitney test to assess statistical significance.
Updated over 1 year ago